Working
with Large Datasets
To begin
this assignment I first downloaded the Assignment 5 data from the cegis folder in Securenet
ftp. I next extracted the data and
connected to its location in ArcCatalog. I then dragged the HUC250 map into the ArcMap.
I then
used Query Builder to define Region 13, the Rio Grande Basin, of the HUC
map. The results are shown below.

I
proceeded to change the color schematic by right clicking on the data layer,
selecting “Properties,” selecting the “Symbology” tab
and then clicking on the Categories tab and defining the attributes by the
feature “SUB.” The result is shown
below.

Next I
added stream and Reservoir data to my map.
I opened the Reservoir layer and opened “Properties,” opened “Symbology,” clicked on the symbol Icon. That opened the Symbol Selector. I then opened the Style References and
selected “Civic” and made sure that “ESRI” was also checked. I pressed ok and then selected the
“Reservoir” symbol in the Symbol Selector.

I
proceeded to select Selection > Select By Attributes and queried the HUC for
"CAT" = '13060001' and applied that to the map. After doing this, I right clicked on the
“huc250k” layer, and followed the path, “Data>Export Data” and then selected
shapefile for the file type and renamed the file “13060001.shp.”
To
select the streams and reservoirs in 13060001, I followed the path
“Selection>Select By Location.” Under “Spatial Selection Method,” I selected
“Target layer(s) features are completely within the source layer feature.” The result is shown below.

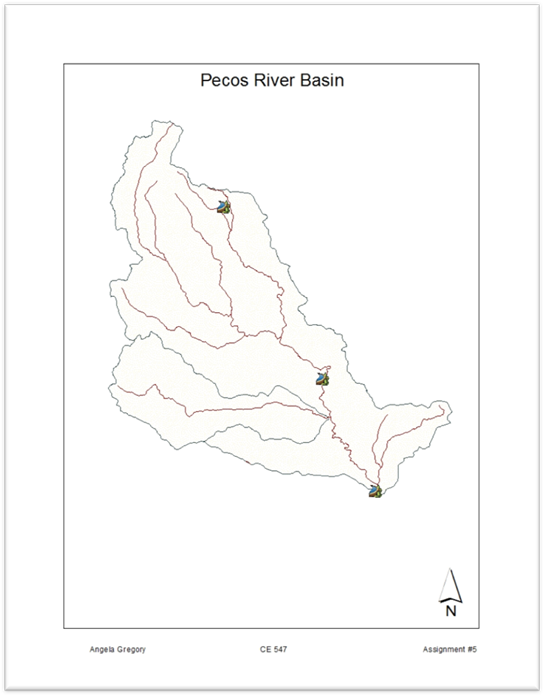
Because
this method did not include the upper reach of the Pecos River, I went back and
added HUC 13060002 as well and repeated the last few steps. The map that was produced is shown below.
I then
added USGS data to the map. I did this
by going to the website http://waterdata.usgs.gov/nm/nwis/annual/?referred_module=sw. I selected the HUC as the Site Selection
Criteria and pressed “Submit.” I then
selected latitude, longitude, altitude, datums for
each site, and site number and downloaded the data to an excel spreadsheet. Afterwards, I opened the spreadsheet and
removed all of the headers. To bring the
data into ArcGIS, I followed the path, File> Add Data> Add XY data and
followed the directions. I set the
projection to NAD 1983.
Next the
data was saved as a layer, by exporting the data to a new shapefile. The result is shown below.

Next I
added temporal data by right clicking on the geodatabase
and selecting “Table (single).” I then right-clicked on the new table and
navigated to Joins and Relates < Join….
I
repeated the above process to join the table with Spatial Data.