Add Data and Join Tables
First
I connected to the Assignment6 geodatabase and pulled
the nm_polygon data into ArcMap.

I
then opened Data Frame Properties and selected the Coordinate System tab, then pressed
modify and changed the central meridian from -96 to -106.

Next,
I changed the color of the individual soil groups by right-clicking on nm_polygon and selecting Properties, selecting the Symbology tab, then went to categories and selected MUID under
the Value Field and “Add All Values.”
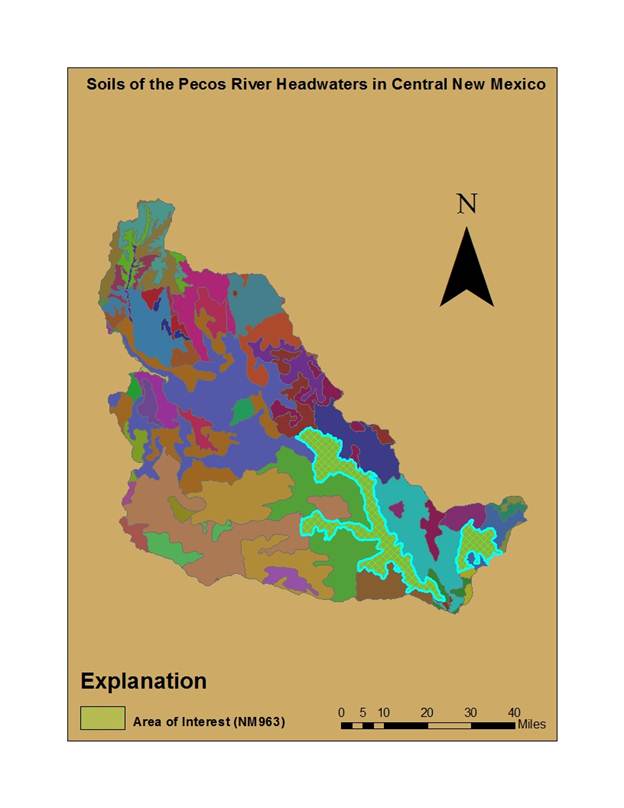
The result is shown below.
Next,
I brought in the Pecos HUC by dragging it into the display screen. I then went to Properties again, selected the
Symbology tab and the symbol and selected “Hollow” so
that I could see the underlying soils data.
I also increased the line width so that the outline of the shape was
more visible.
To
get the soil data that is within the Pecos river basin, I went to ArcToolbox > Analysis Tools > Extract > Clip. In the Input Features, I selected “nm_polygon”, in Clip Features selected “PecosHUC,”
and then changed the location of the Output Feature Class.

Next,
I began to add metadata to ArcMap to make my soil map
meaningful. I brought in the files named
“comp,” “layer,” and “mapunit” to ArcMap. I then right-clicked the PecosHWSoils
layer and went to the Joins & Relates>Join. I joined together PecosHWSoils
with the mapunit data based on the MUID.
I
then related the comp table to the PecosHWSoils layer
by right-clicking PecosHWSoils> Joins & Relates > Relate.
Calculating Soil Properties
1. Describe the NM963 soil in terms of its
properties in the Mapunit and Component Tables.
In the mapunit
table, NM963 is described as a Reginer-Latom-Rock Outcrop.
In the Component Table, NM963 is described as having 7 individual
component names.
2. How many components does it have?
It
has 8 components.
3. What are their names?
There
are five actual component names: Regnier, Latom, Rock Outcrop, Los Tanos,
and Gallen. The
remaining three vary from others based on their ranges of slope.
4. What percentage of the map unit does each
component comprise?
Regnier (36%), Latom(32%), Rock Outcrop(18%), Los Tanos(12%),
and Gallen(2%).
Again, this does not include differences in slope.
5. What is the predominant surface slope where
this soil unit is found?
The
predominant surface slope is 2% (average of 1-3%)- 15%
composed of both the Regnier and Latom
soil components. The overall average of
the predominant surface slope is 7.5%.
6. What is the dominant soil texture?
The
dominant soil texture is clay.
7. What percentage of the soil is in hydrologic
soil groups A, B, C, D?
A
is 0%, B is 2%, C is 12% , and D composes 86% of the Regnier soil group.
8. Do these soil properties make sense considering
where this soil is located?
Yes,
the soil properties make sense.
Average
Water Holding Capacity for the Map Unit:
1. For mapunit NM963,
how many layers does each component have?
|
Component |
Number of Layers |
|
1 |
3 |
|
2 |
2 |
|
3 |
1 |
|
4 |
3 |
|
5 |
3 |
|
6 |
2 |
|
7 |
3 |
|
8 |
4 |
2. What is the total soil depth (inches) for each
layer and the average depth (inches) for the map unit?
|
Component |
Layer |
Total Soil Depth
(in) |
|
1 |
1 |
0-9 |
|
1 |
2 |
9-18 |
|
1 |
3 |
18-22 |
|
2 |
1 |
0-8 |
|
2 |
2 |
8-20 |
|
3 |
1 |
0-60 |
|
4 |
1 |
0-6 |
|
4 |
2 |
6-24 |
|
4 |
3 |
24-28 |
|
5 |
1 |
0-9 |
|
5 |
2 |
9-18 |
|
5 |
3 |
18-22 |
|
6 |
1 |
0-8 |
|
6 |
2 |
8-20 |
|
7 |
1 |
0-9 |
|
7 |
2 |
9-18 |
|
7 |
3 |
18-22 |
|
8 |
1 |
0-4 |
|
8 |
2 |
4-15 |
|
8 |
3 |
15-25 |
|
8 |
4 |
25-60 |
The
average total depth for the map unit is 29.68 inches.
3. What is the total water holding capacity
(inches of water) over the full soil depth for each component?
|
Component |
Total Water Holding
Capacity (in) |
|
1 |
7.48 |
|
2 |
2.5 |
|
3 |
0 |
|
4 |
7.56 |
|
5 |
7.48 |
|
6 |
1 |
|
7 |
5.94 |
|
8 |
16.8 |
4. What is the average water holding capacity
(inches of water) for soils in this map unit?
The
average water holding capacity for the soils in the map unit is 4.63 inches.
Next
I went to the rgis.unm.edu website and found two coverages,
one for Ft. Sumner and one for Santa Fe.
I merged the files together and then clipped them to the Pecos HUC
file. The result is shown below.

I
next changed the symbology and labels to represent
the different Anderson Land Use Codes.
The result is shown on the next page.
