Assignment 1: Create and
post a simple webpage. Include at least
three figures from the exercises you worked in Chapter 3 of Getting to Know
ArcGIS
Exercise 3a: Displaying Map data
In this exercise, we learn how to
display data in ArcMap. Also, how to navigate a map, use basic tools, and look
at feature attributes over the course of four exercises using the ArcMap
component of ArcGIS. First, we open the exercise file ‘ex03a.mxd’ supplied with
the book resources. This open a world map with several spatial data sets or
layers like Cities, Latlong, Countries, World
Population, Air Pollution by County, and Ocean. These layers can be turned on
and off by clicking on them. By manipulating these tools, we can find out
information from the map such as population, co-ordinates of places,
information regarding air pollution etc.
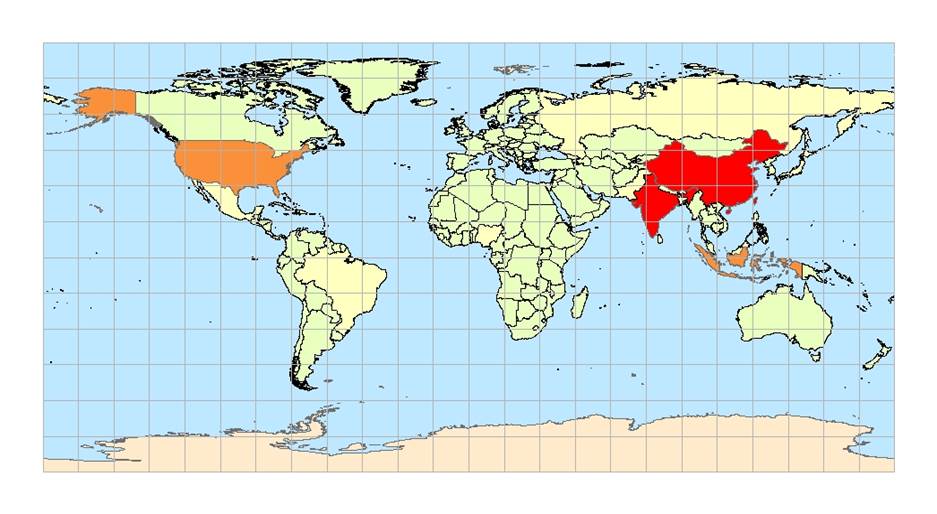
Figure 1: Countries by their population, the oceans and the lat-long grid
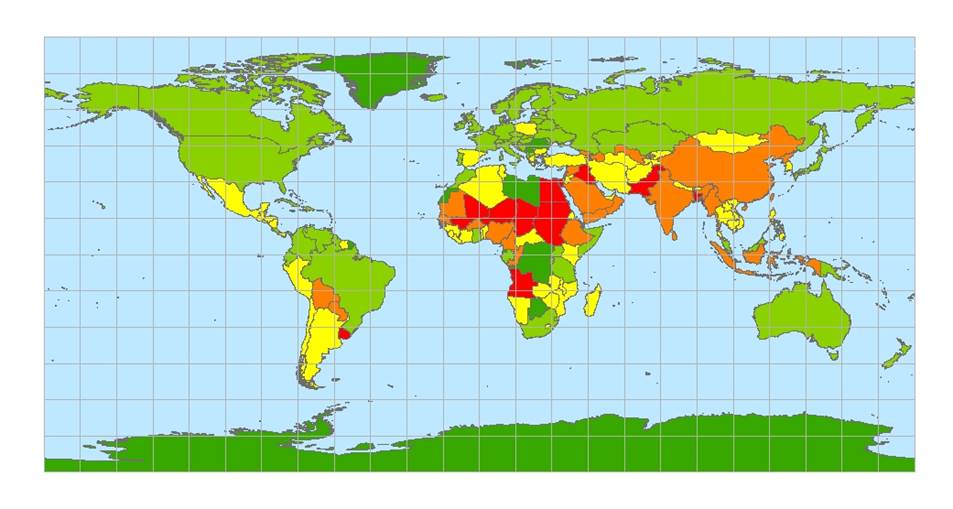
Figure 2: Countries by air pollution, the oceans and the lat-long grid
From Figure 1, two countries display population greater than 500 million. They are India and China. But it is evident from figure 2 that high pollution does not correlate with population.
Exercise 3b: Navigating a Map
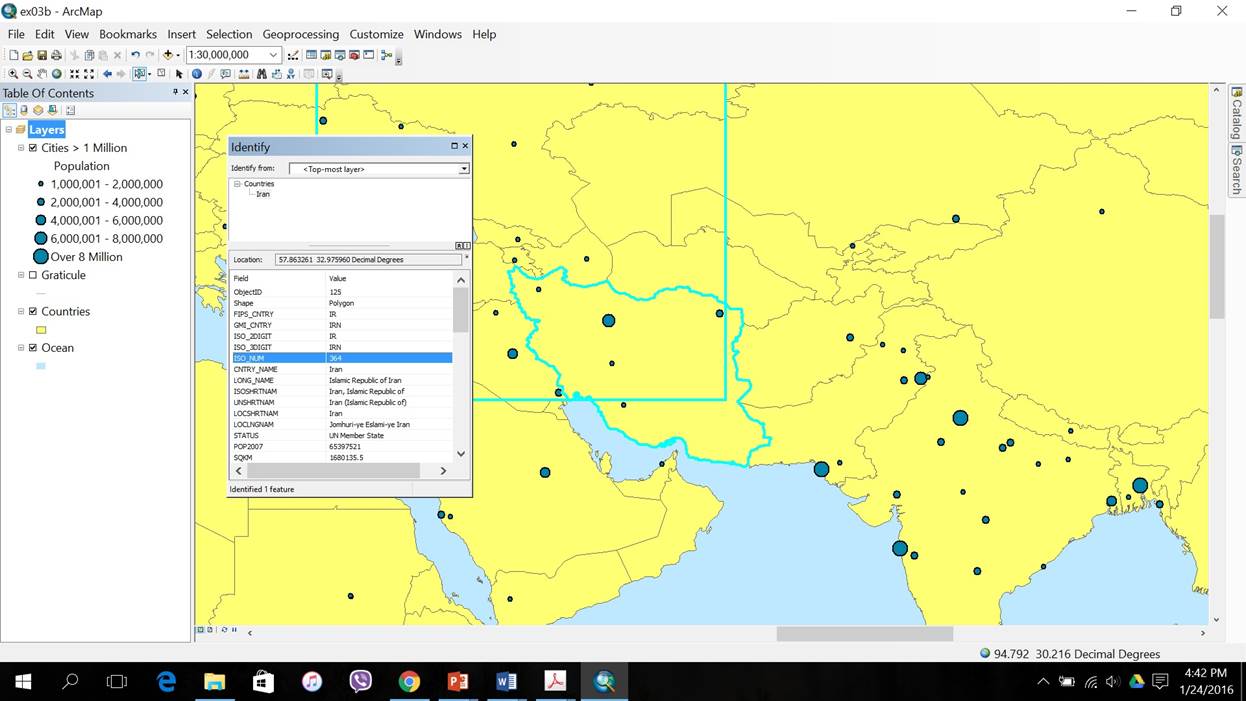
Figure 3: Navigating a Map and Identify features
In this exercise, we learn to zoom and pan around a map, use MapTips and identify features and examine their attributes. For example we can select the map of Iran by using the identify tool and find out information such as ISO number which is 364 for Iran.
Exercise 3c: Using basic tools
In this exercise, we learn about
the common ArcMap tools and functions that facilitates data exploration beyond
navigation. For example, we can use the viewer window for alternate views of
the map.
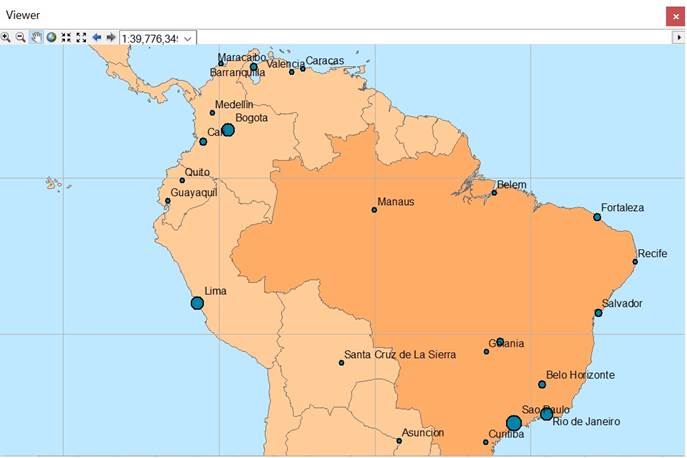
Figure 4: The use of the viewer window
Also, we learn to use the measure tool to calculate the shortest distance between two points. For example, the shortest distant from New York to Shanghai is over 11000 km as shown in the figure.
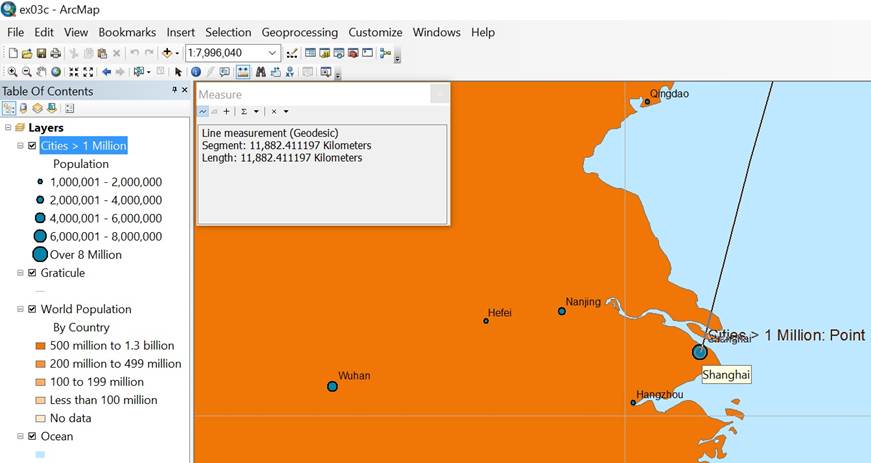
Figure 5: Shortest distance between two points
Exercise 3d: Looking at feature
attributes
In this exercise, we learn to
extract information by looking at the feature attributes of a map. For example,
by sorting the attributes in descending order by their population, we find out
the total number (sum) of people living in the 12 largest cities are 136,941,620.
And the number of cities with values under 11,508,260 is 8.
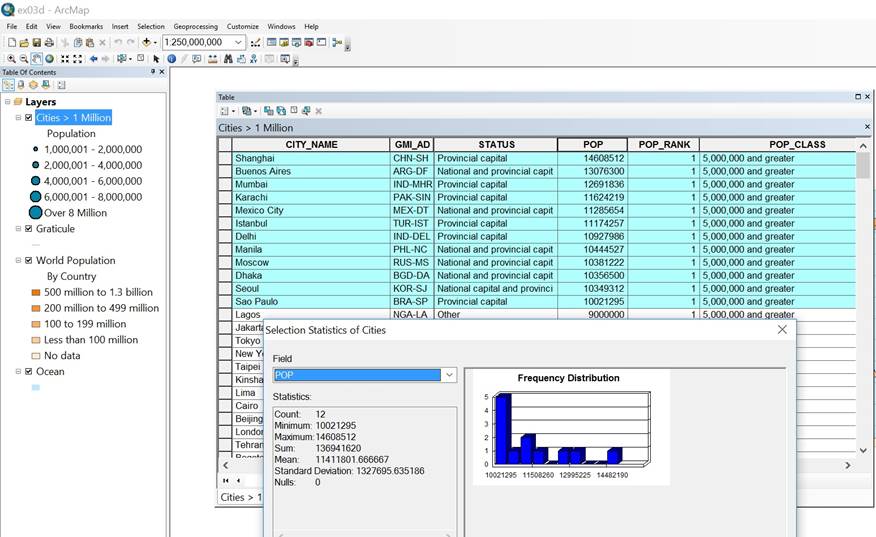
Figure 6: Selecting features by their attributes