Assignment 2
This assignment gives an opportunity to familiarize with the ArcMap Environments. The goal is to create a map illustrating the pan evaporation data for different locations within New Mexico.
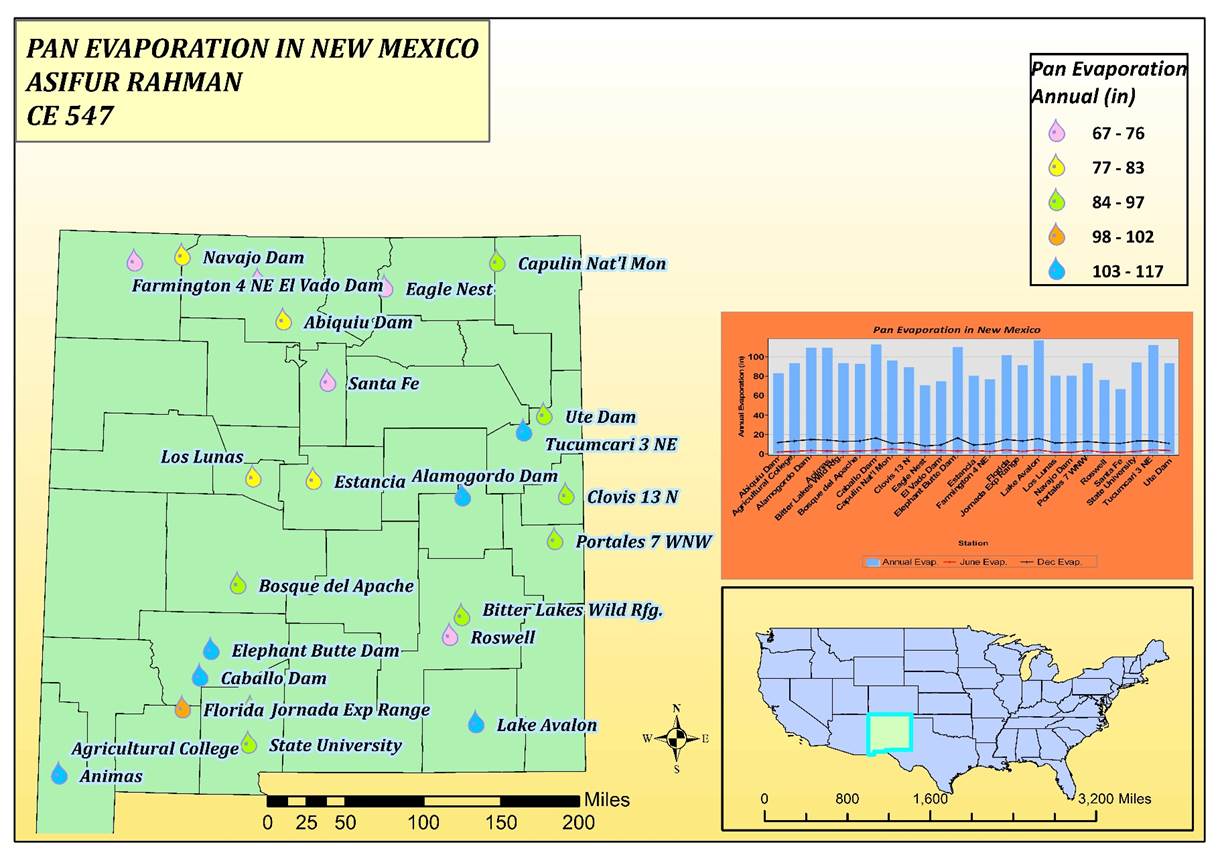
At first the base maps are added and meta-data from the maps are extracted. Then, in the symbology features, pan evaporation ranges are created with symbols to describe the ranges. For this map, graduated symbols have been used. In this way, the features on the map are symbolized easily to extract information from the map. After that, a graph of annual evaporation vs station name has been created. The graph gives a picture of annual evaporation at various stations. Evaporation for the months of June and December is also shown on the map. Finally, the layout of the map has been created to show all the information in a convenient way.
From The map, it is evident that the stations that exhibit greater evaporation are in the southern region. The stations that have the highest evaporation are Caballo Dam, Elephant Butte, Lake Avalon and Tucumcari 3 NE. The stations that have the lowest evaporation are Eagle Nest, Santa Fe etc.
I faced some difficulties in creating a map layout:
1. I found it difficult to control the scale of the map in map view and layout view.
2. It took me some time to find a suitable color combination for the map.
3. I found it hard to change the decimal places for different evaporation ranges on the legend. I had to do it manually.
I am looking to do more practice to overcome the difficulties and also to expand my skill for future assignments.