CE 547
Assignment 5 – Watershed Discharge
This assignment involves downloading data from the USGS website and using the GIS tools to create Rio Pecos watershed gage site historical data. This assignment covers the techniques learned so far like selecting the Pecos River basin using query statements “Cat”= ‘13060001’ OR ‘13060002’ and streams, reservoirs and boundaries of Rio Pecos and exporting the selected data to a new layer.
I went to the USGS website and downloaded the historical stream gage data for the Rio Pecos watershed and exported those to an excel file. Then I imported the excel files to ArcGIS to incorporate the data along with the basin shape file.
Lastly, I added the attribute data to the data layer. This involved setting the geographic coordinate system to NAD 1983 so that the location of the gage sites do not fall outside the map area.
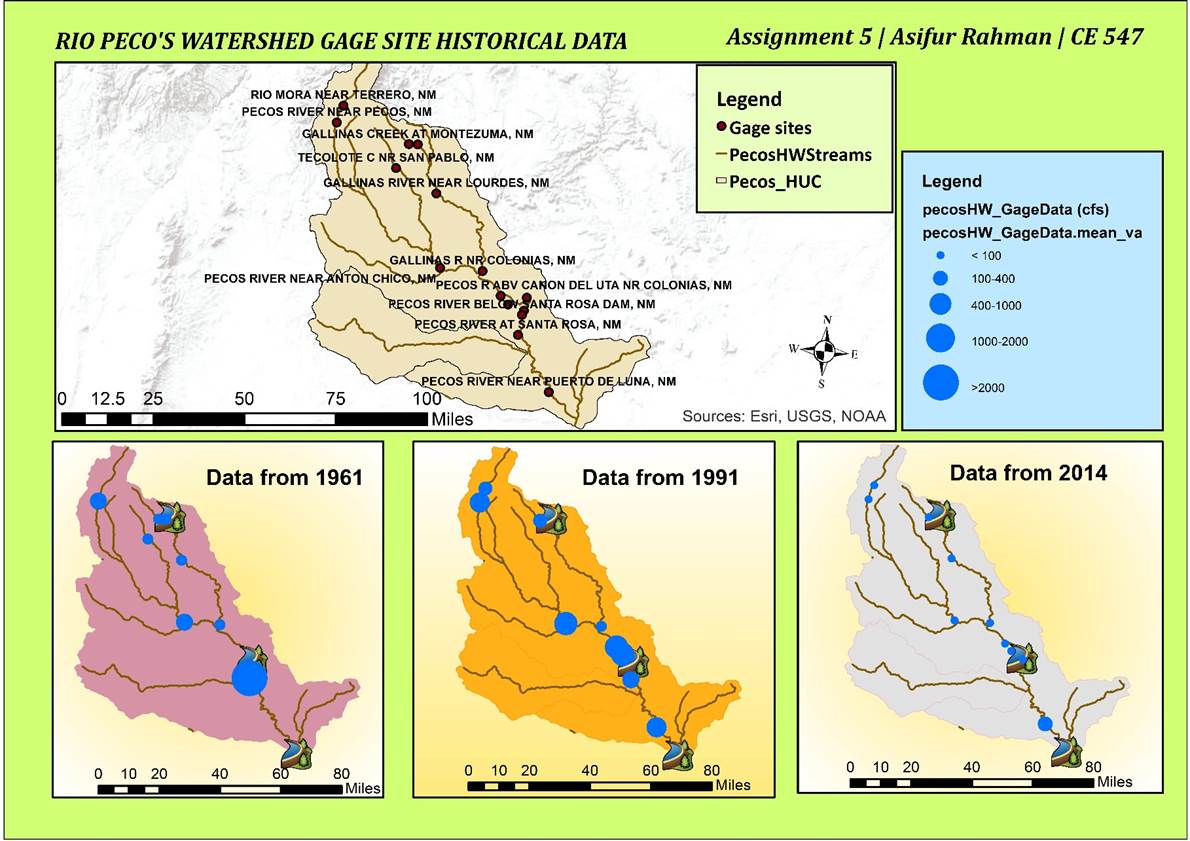
The final map shows the gage sites in a watershed map and three different maps showing the mean discharge for years 1961, 1991 and 2014. The map tells a story about how the discharge changes along Rio Pecos watershed. For 1961, the discharge gradually increases downstream. But for 1991 and 2014, the increase is not differentiable. This shows that discharge has decreased over the years.