Assignment #2: New Mexico Pan Evaporation Data
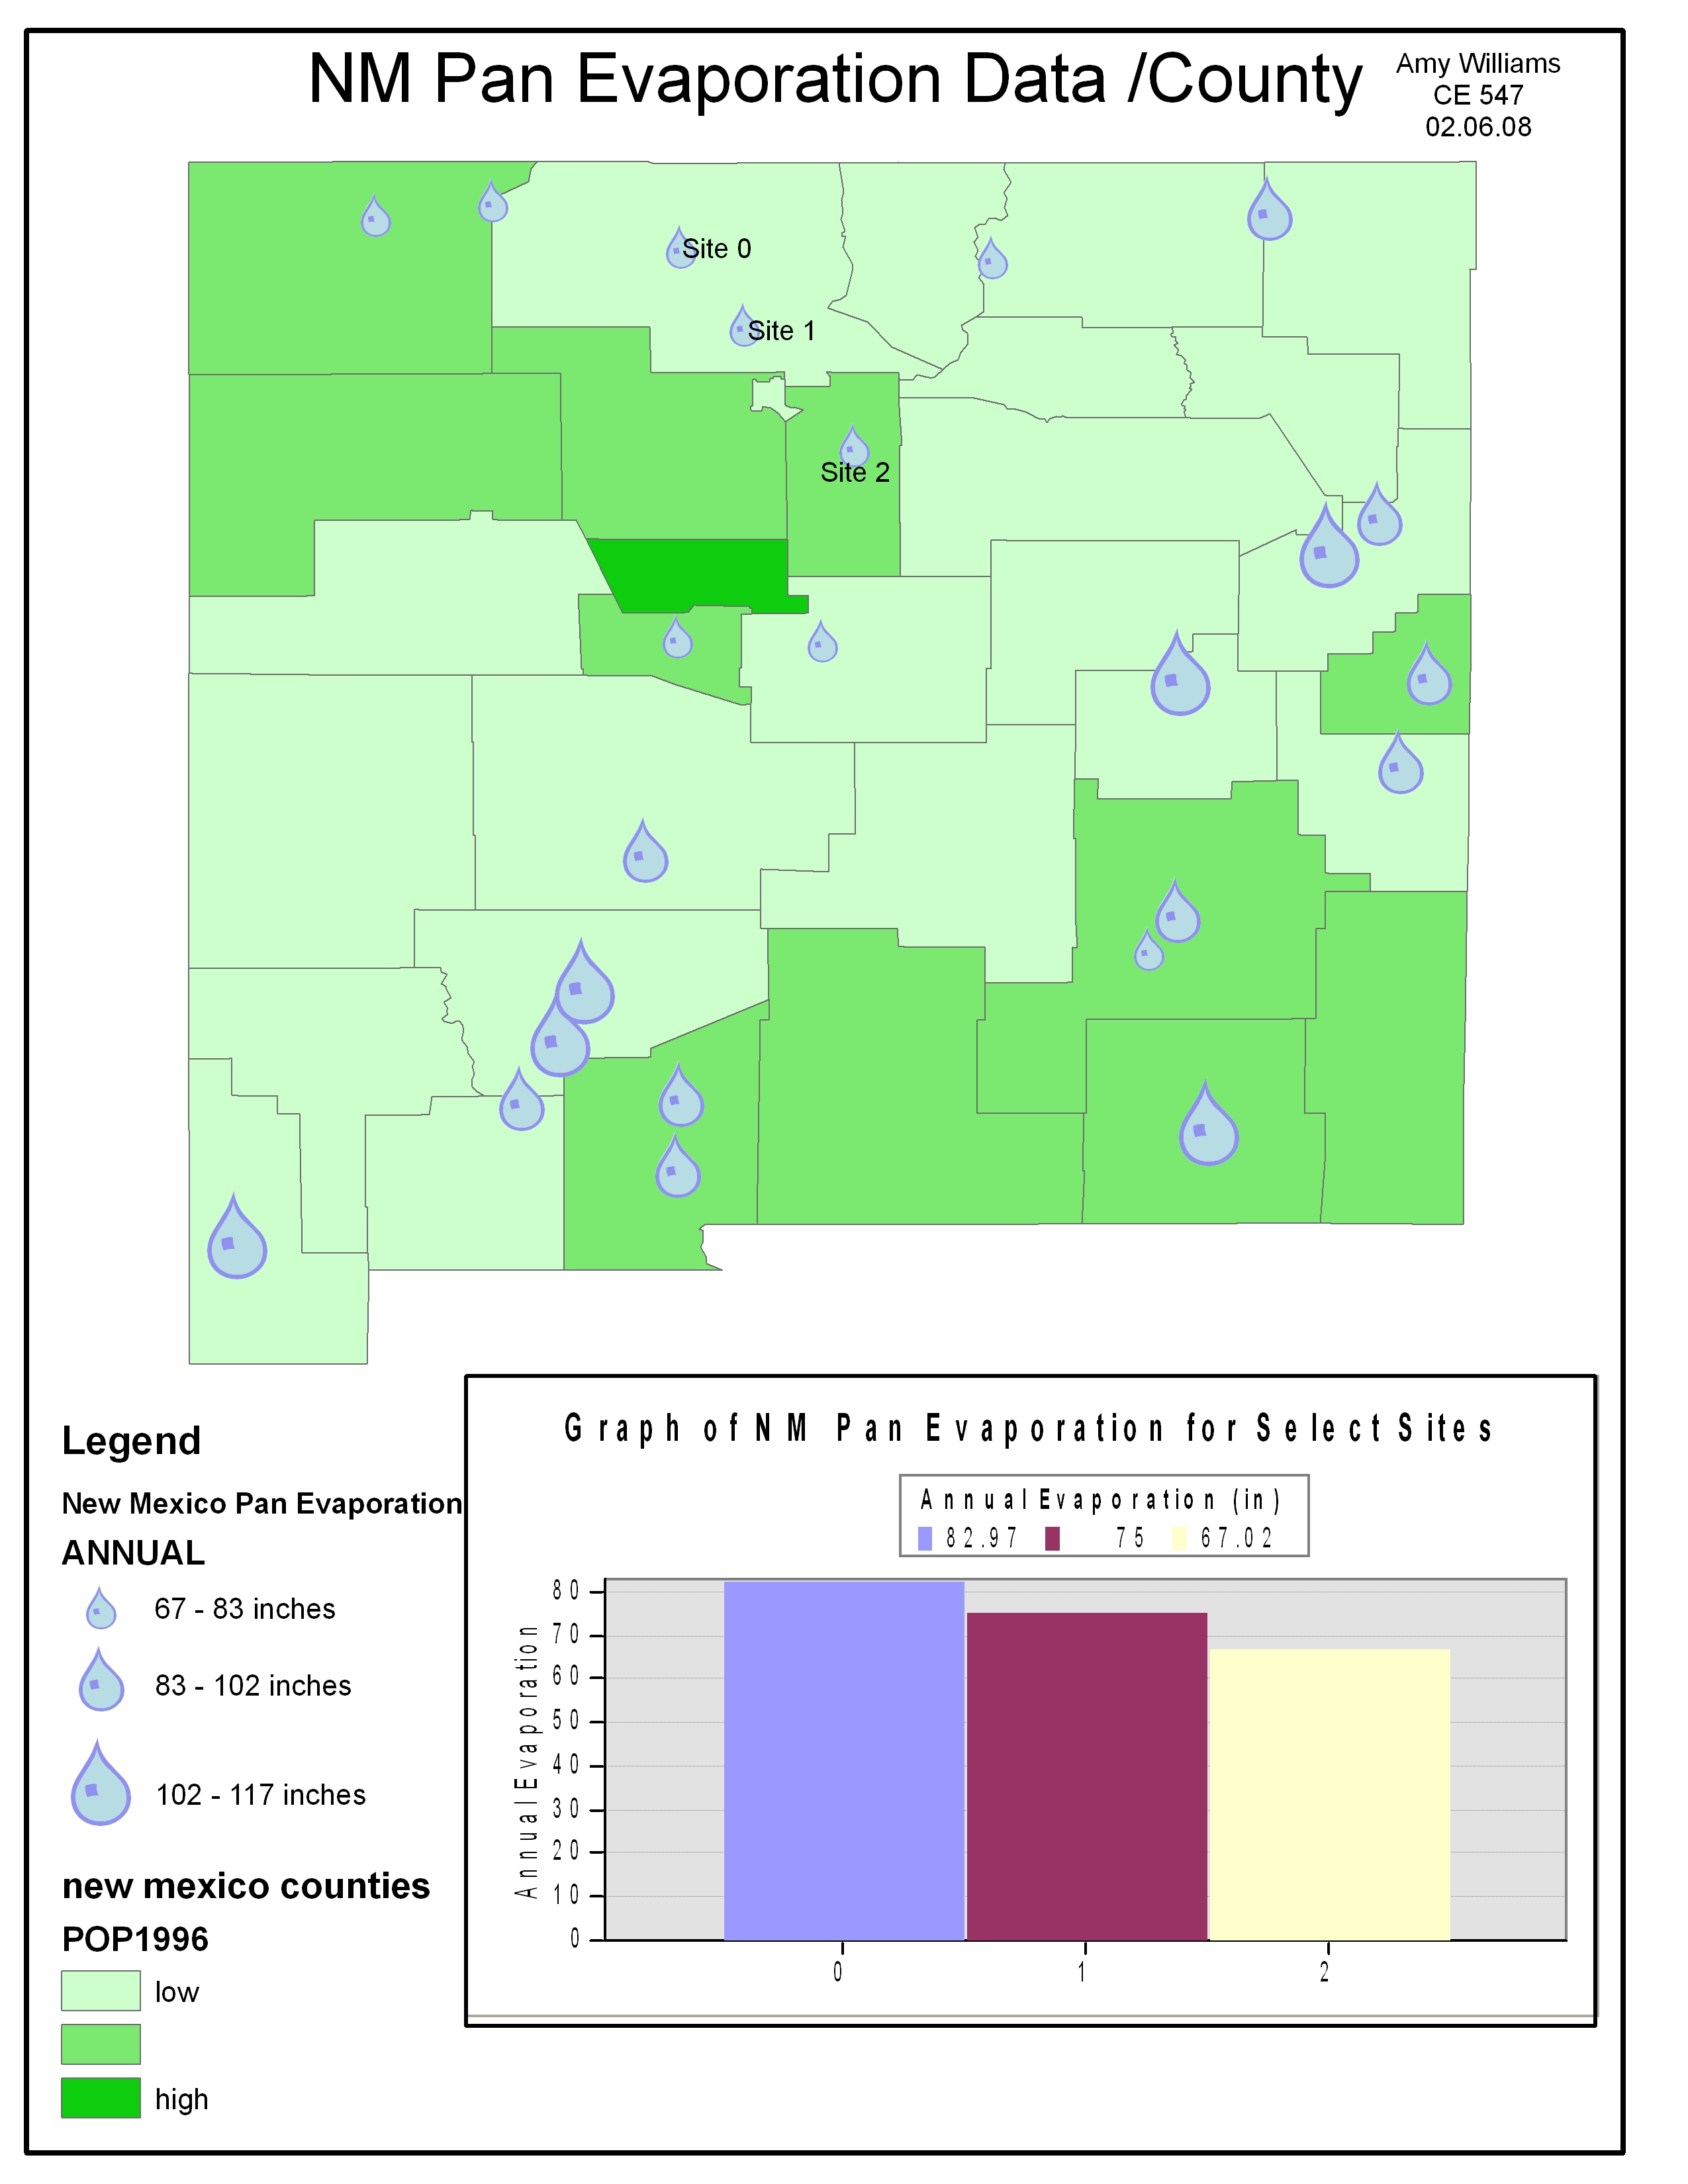
Figure 1. Map of pan evaporation experiment sites per county for New Mexico with graph of annual precipitation
averaged from 1969-1979, 1936-1975, and 1916-1955, respectively.