Does Process Matter?
An Evaluation of the Effect of Sample Processing Treatments
on Alkalinity Measurements
Amy Williams
Presented in partial fulfillment for the degree of Bachelor
of Science in Earth and Environmental Sciences
Furman University
2007
Acknowledgments
Thanks to Connie Gawne
and Lee Mitchell, South Carolina Department of Natural Resources, for their
assistance in locating and sampling Gowensville wells, to Wes Dripps for assistance in field sampling, and to Suresh Muthukrishnan for GIS assistance. Special thanks to Tracy
Jones, Department of Geology, University of Tennessee-Chattanooga, for her
assistance in the field and other logistical support. Thanks to Chris Priedemann
for baking cookies for the night spent in the lab. Very special thanks to Ivan
Irizarry for assistance with field sampling, alkalinity analysis, GIS mapping
and being there. Also very special
thanks to Selena “Spang” Pang to assistance in field
sampling and maintaining sanity. Thanks to Lori Nelsen for her guidance and
assistance in laboratory analyses and listening to the griping. Finally, the most thanks goes to my advisor,
Brannon Andersen, for suggesting the project and pushing me to work harder than
I ever thought possible.
Funding was provided by a NSF-Research
Experiences for Undergraduates grant (NSF-REU Grant #EAR-0453205), NSF-MRI
Grant #EAR-0116487, Saluda Reedy Watershed Consortium Grant C2-04, and by
Furman University.
Abstract
The concentration of bicarbonate, the dominant
anion in river water, is calculated using measured alkalinity
concentrations. Although the Gran
Titration is the standard research method for measuring alkalinity, there is
variation in how water samples are processed.
The purpose of this study was to determine whether variation in
processing methods leads to statistically significant differences in alkalinity
concentrations in 1) stream and ground waters influenced by high-grade silicate
metamorphic rocks and in 2) stream waters influenced by carbonate rocks.
Samples were collected from
the piedmont region of northwestern South Carolina and the ridge and valley
region of eastern Tennessee. Aliquots
of each sample were collected in triplicate using four processing treatments: filtered and refrigerated, filtered and unrefrigerated,
unfiltered and refrigerated, and unfiltered and unrefrigerated. All aliquots were analyzed within 24 hours
using the Gran Titration method. Two-way
ANOVA results indicate that there were predominantly no statistically
significant differences among the various treatments any of the water
samples. Few samples demonstrated some
statistically significant differences, but the difference between the means was
less than 3%. The alkalinity
concentrations of all samples were determined again after 17 to 51 days of
storage to determine if storage time affects alkalinity measurements.
Our results suggest that
alkalinity concentrations measured on surface water and ground water samples
collected in the piedmont region and surface waters collected in the valley and
ridge region are not dependent on processing treatment. Our recommended treatment of fresh surface
water samples is filtered and refrigerated to maintain the chemical integrity
of the samples.
Introduction
Rivers
serve as a major carbon transportation system between terrestrial sources and
the ocean (Ramesh et al. 1995; Edmond et al. 1995). They are also a major
source of carbon flux to the atmosphere during transit (Richey et al. 2002; Oechel et al. 2000).
Thus it is important to have an understanding of the biogeochemical cycling of carbon in rivers and the geologic
sources and sinks that feed this cycle. Forms
of riverine carbon can include dissolved organic carbon (DOC), particulate
organic carbon (POC), particulate inorganic carbon (PIC), and dissolved
inorganic carbon (DIC) (Meybeck et al. 2003).
In the waters we studied, DIC was typically in the form of bicarbonate
(Dawson et al. 2002; Meybeck 1993).
Bicarbonate
is generally the most important anion in 98% of world rivers flowing into the
ocean (Meybeck 1993) and is the dominant carbonate species in 50% of river
basins and 40% of U.S. ground waters (Meybeck et al. 2003; Eby
et al. 2004). In the typical pH range
(pH 6-8.2) for surface and ground waters, bicarbonate DIC can contribute a
significant amount to the carbon flux between terrestrial waters and the
atmosphere. The two sources of DIC are i) silicate weathering by carbonic acid (including
oxidation of sedimentary organic matter found in some rocks and uptake of atmospheric and soil CO2
during weathering (Meybeck 1993)) and ii) dissolution of carbonates, such as
calcite and dolomite (Meybeck 2004). In
rivers influenced by carbonates, DIC is controlled by both Pco2 in
soils and the ambient temperature (White, 1984).
Of the forms of dissolved carbon, it is most
problematic to quantify the flux of DIC because it consists of 3 carbonate
species and easily degases. Thus the method of sample processing before
analysis is important to preserving the integrity of the alkalinity. Total dissolved inorganic carbon (DIC) can be
measured directly (Raymond et al. 1997), although this method is less
common. More commonly, DIC and inorganic carbon species are calculated using a
thermodynamic model utilizing stream or ground water temperature, pH, and
alkalinity as model variables. Of these
three variables, pH and alkalinity have the greatest uncertainty, with
temperature measurements being generally reliable. The uncertainty in pH measurements
in natural waters (Piñol et
al. 1992; Raymond et al. 1997) can be attributed to high sample Pco2
(partial pressure of carbon dioxide) values (Cai et al. 1998), variable temperatures, errors due to
using a large buffer range (Howland et al. 2000), and analytical error, i.e.
electrode aging and variation in liquid junction (Pytkowicz
et al. 1966). Despite these
uncertainties, the focus of this study will be on the determination of
alkalinity.
Alkalinity
often is the key to the calculation of Pco2, charge balance, and
carbonate speciation. The Pco2 in rivers is important to the global carbon
cycle because it can be used to describe carbon fluxes to the atmosphere and
the ocean (Neal et al. 1998b). Charge
balances provide us with an error range to check the accuracy of our results. The carbonate speciation is calculated from
measurements of pH, temperature, and alkalinity (McDowell et al. 1994;
Raymond et al. 1997), provided alkalinity is primarily in the form of
bicarbonate and carbonate. The variation in carbonate speciation is a function of the
natural weathering of the underlying geology, the contributions from headwater
streams, and the introduction of anthropogenic sources (Richey et al. 1990).
Gran
Titration is the standard method for measuring alkalinity, but there is some
variation in how surface water samples are
processed. In the Standard Methods
(1995), it is recommended that alkalinities are measured within 24 hours of
collection on unfiltered samples, with a maximum of 14 days of refrigerated
storage. A variety of methods have been
used to demonstrate a range of treatment methods with conditions
affecting titration, filtration, refrigeration, depth of grab samples, and
method of alkalinity measurement (Table 1). There is no consensus on which is
the most reliable and there is no consistent method that is used in all of the
following papers, although the Gran Titration method of alkalinity measurement
was used in 26 of the 38 papers surveyed.
Samples
can be titrated in the field (Pinol et al. 1992;
Barth et al. 2003; Richey et al. 1990; Cameron et al. 1995; Grimaldi
et al. 1999; Hoffer-French et al. 1989; Katz et al.
1985), or in the lab (Cai et al. 1998; Zhang et al.
1995; Standard Methods 1995; Rice et al. 1995; Grosbois
et al. 2001; Guasch et al. 1998; Helie
et al. 2002; Hill et al. 2002; Hoffer-French et al.
1989; Howland et al. 2000; Huh et al. 1998; Jones Jr. et al. 1998; Kim et al.
1996; Lewis Jr. et al. 1979; Lewiss Jr. et al. 1987;
McDowell et al. 1994; Pamde et al. 1994; Ometo et al. 2000; Edmond et al. 1995). Samples can be filtered
(Neal et al. 1994; Grosbois et al. 2001; Huh et al.
1998; Rice et al. 1995; Zhang et al. 1995; Jarvie et
al. 2002; Katz et al. 1985; Pande et al. 1994;
Williams et al. 2001; Wu et al. 2005; Cameron et al. 1995; Finley et al. 1997;
Howland et al. 2000; Kim et al. 1996; Edmond et al. 1995) or not (Standard
Methods 1995; Dawson et al. 1995; Hill et al. 2002; Hoffer-French
et al. 1989; Jones Jr. et al. 1998; Lesack et al.
1991; Lewis Jr. et al. 1979; Neal et al. 2000, Edmond et al. 1995), and
refrigerated before anaylsis (Rice et al. 1995;
Standard Methods 1995; Billett et al. 1996; Dawson et
al. 2001; Guasch et al. 1998; Helie
et al. 2002; Hill et al. 2002; Hoffer-French et al.
1989; Jarvie et al 2002; Jones Jr. et al. 1998; Katz
et al. 1985; Kim et al. 1996; Lesack et al 1991;
Raymond et al 1997; Neal et al. 2002) or not (Barth et al. 2003; Howland et al.
2000; Lewis Jr. et al. 1979; Edmond et al. 1995). With all of the water treatment
methods available, a study of reliable treatment methods is necessary to
establish realistic expectations for the treatment of waters intended for
alkalinity measurement.
|
Table 1. Summary of treatment methods from previous
water chemistry studies. ?= not reported; In lab=no time limit specified |
||||
|
Author |
Titration
occurred: |
Filtration
occurred: |
Refrigeration
conditions: |
Method
of Alkalinity Measurement |
|
Piñol 1992 |
On site |
Nr |
Nr |
End Point |
|
Neal 1994 |
Nr |
On
site |
Nr |
Gran
Acidity |
|
Neal 1988 |
2
hours |
Nr |
Nr |
Modified
Gran Titration |
|
Cai 1998 |
In lab |
Nr |
Nr |
Gran
Titration |
|
Barth 2003 |
On site |
Nr |
Field Temperature |
End Point |
|
Zhang 1995 |
In lab |
On site |
Nr |
Gran Titration |
|
Rice 1995 |
In lab |
Yes |
At 4°C |
Modified Gran Titration |
|
Standard
Methods 1995 |
24
hours |
No
filtering |
At 4°C |
End
Point |
|
Richey
1990 |
On
site |
Nr |
Nr |
Gran
Titration |
|
Billett 1996 |
24
hours |
Nr |
At 4°C |
Nr |
|
Cameron
1995 |
On
site/ 24 hour |
12
hours |
Nr |
Nr |
|
Dawson
2001 |
Nr |
No
filtering |
At 4°C |
End
point (pH 4.5 and 4.0) |
|
Finley
1997 |
4
hours |
Same
day |
Nr |
Gran
Titration |
|
Grimaldi 1999 |
On
site |
Nr |
Nr |
Gran
Titration |
|
Grosbois 2001 |
In
lab |
On
site |
Nr |
Gran
Titration |
|
Guasch 1998 |
In
lab |
Nr |
At
4°C |
Gran
Titration |
|
Helie 2002 |
In
lab |
On
site |
At
4°C |
Gran
Titration |
|
Hill
2002 |
In
lab |
No
filtering |
At
4°C |
Modified
Gran Titration |
|
Hoffer-French 1989 |
On
site/ In lab (within 48 hours) |
No
filtering |
On
ice when in lab |
Gran
Titration |
|
Howland
2000 |
In
lab |
Same
day |
Room
temperature/ in the dark |
Gran
Titration |
|
Huh
1998 |
In
lab |
On
site |
Nr |
Gran
Titration |
|
Jarvie 2002 |
24
hours |
On
site |
At
4°C |
Modified
Gran Titration |
|
Jones
Jr. 1998 |
In
lab |
No
filtering |
At
4°C |
End
Point |
|
Katz
1985 |
On
site |
On
site |
At
4°C |
Gran
Titration |
|
Kim
1996 |
In
lab |
12
hours |
At
4°C |
Gran
Titration |
|
Lesack 1991 |
24
hours |
No
filtering |
At
4°C |
Gran
Titration |
|
Lewis
Jr. 1979 |
Just
after collection in lab |
No
filtering |
Room
temperature |
End
Point |
|
Lewis
Jr. 1987 |
In
lab |
Just
after collection |
Nr |
Gran
Titration & End Point |
|
McDowell
1994 |
Just
after collection in lab |
Nr |
Nr |
IR
spectroscopy (DIC) |
|
Pande 1994 |
In
lab |
On
site |
Nr |
Titrimetry |
|
Ometo 2000 |
In
lab |
Yes |
Nr |
Gran
Titration |
|
Raymond
1997 |
24
hours |
nr |
At
4°C |
Syringe
gas stripping method (Stainton 1973) (DIC) |
|
Risacher 2002 |
nr |
Yes |
Nr |
Electrometric
titration |
|
Williams
2001 |
In lab |
On
site |
Nr |
Gran
Titration |
|
Wu 2005 |
In lab |
On
site |
Nr |
Gran
Titration |
|
Neal
2000 |
3 days |
No |
At
4°C |
Modified
Gran Titration |
|
Neal
2002 |
In lab |
Nr |
Nr |
Modified
Gran Titration |
|
Edmond
1995 |
In lab (weeks later) |
5
hours- several days |
No |
Gran
Titration |
The purpose of our study was to determine
whether variation in processing treatments (filtration, refrigeration, and
storage time) lead to statistically significant differences in alkalinity
concentrations. This research was
conducted on surface and ground water samples from the piedmont region of
northwestern South Carolina and the valley and ridge region of eastern
Tennessee. If alkalinity measurements do
not show a meaningful statistically significant difference between treatment
methods, then we assume that samples can undergo any treatment method without
reducing the accuracy of charge balance, carbonate speciation and PCO2
calculations. Not having a meaningful difference is defined as having a change
in alkalinity measurements so small that the change in the final calculations
based on these measurements does not affect the outcome of the study (from
sample locality NC02, a change in alkalinity of 1 mg CaCO3/L does
not affect the results of the study). Our
previous studies demonstrated that alkalinity values measured in the lab
provided
charge balances well within 10%. Based on this data, we did not compare the
results of field versus lab measurements.
This study found that there
were no meaningful statistically significant differences between filtration,
refrigeration, or storage time for alkalinity measurements from piedmont and
carbonate surface and ground waters with low turbidity and undersaturated with
respect to calcite. Because
the range of alkalinities sampled in this study represent over 85% of world
surface waters (Table 2), and 40% of U.S. ground waters (Table 3), we concluded
that, while this research is widely applicable, it is not to be used without considering
other geochemical effects.
|
Table 2. Bicarbonate concentrations from rivers
around the world. (from Berner et al., 1996) |
|||
|
Continent |
River |
HCO3- (mg/L) |
Reference |
|
N. America |
Colorado 1960s |
135 |
A* |
|
|
Columbia |
76 |
A |
|
|
Mackenzie |
111 |
A |
|
|
St. Lawrence |
75 |
A |
|
|
Yukon |
104 |
A |
|
|
Mississippi 1905 |
116 |
A |
|
|
Mississippi 1965 |
118 |
A |
|
|
Frazer |
60 |
A |
|
|
Nelson |
144 |
A |
|
|
Rio Grande:Laredo |
183 |
B* |
|
|
Ohio |
63 |
B |
|
Europe |
Danube |
190 |
A |
|
|
U. Rhine:unpolluted |
114 |
C* |
|
|
U. Rhine:polluted |
153 |
C |
|
|
Norwegian rivers |
12 |
A |
|
|
Black Sea rivers |
136 |
A |
|
|
Icelandic rivers |
35.5 |
A |
|
S. America |
U. Amazon:Peru |
68 |
D* |
|
|
U. Amazon:Brazil |
20 |
D |
|
|
L. Negro |
0.7 |
D |
|
|
Madeira |
28 |
D |
|
|
Parana |
31 |
A |
|
|
Madgdalene |
49 |
A |
|
|
Guyana rivers |
12 |
A |
|
|
Orinoco |
11 |
A |
|
Africa |
Zambeze |
25 |
A |
|
|
Congo (Zaire) |
13.4 |
E* |
|
|
Ubangui |
19 |
E |
|
|
Niger |
36 |
A |
|
|
Nile |
134 |
A |
|
|
Orange |
107 |
A |
|
Asia |
Brahmaputra |
58 |
F* |
|
|
Ganges |
127 |
F |
|
|
Indus |
90 |
A |
|
|
Mekong |
58 |
A |
|
|
Japanese rivers |
31 |
A |
|
|
Indonesian rivers |
26 |
A |
|
|
New Zealand rivers |
50 |
A |
|
|
Yangtze (Changjiang) |
120 |
G* |
|
|
Yellow (Hwanghe) |
182 |
G |
|
|
Ob |
79 |
H* |
|
|
Yenisei |
74 |
A |
|
*A= Meybeck 1979, B=Livingstone 1963, C=Zobrist & Stumm 1980, D=Stallard 1980, E=Probst 1992,
F=Sarin 1989, G=Zhang 1990, H=Gordeev
& Siderov 1993. |
|||
|
Table 3. Bicarbonate concentrations from US ground
waters. (from Eby et al., 2004) |
|||
|
State |
Dominant Rock |
HCO3- (mg/L) |
Reference |
|
Central Florida |
Carbonate |
124 |
A |
|
Central Pennsylvania |
Carbonate |
279 |
B |
|
Montana |
Sandstone |
2080 |
C |
|
New Mexico |
Gypsum |
143 |
C |
|
California |
Serpentine |
1300 |
C |
|
Rhode Island |
Granite |
38 |
C |
|
Maryland |
Gabbro |
37 |
C |
|
Hawaii |
Basalt |
84 |
C |
|
New Mexico |
Rhyolite |
77 |
D |
|
North Carolina |
Mica schist |
69 |
D |
|
West Virginia |
Sand and gravel |
101 |
D |
|
Alabama |
Limestone |
146 |
D |
|
*A=Back & Hanshaw
1970, B=Langmuir 1971, C=Matthess 1982, D=Hem 1970. |
|||
Study
Area
Surface and ground water samples were collected from seven
localities in the piedmont region of South Carolina (Fig.1) and four localities
in the valley and ridge region of eastern Tennessee (Fig.2). Sample localities
were chosen to represent the greatest range of alkalinities possible, dependent
on the underlying geology, i.e. non-soluble compared to highly soluble
minerals.
Piedmont Region Localities
The piedmont region is characterized by metamorphic and
igneous silicate rocks (granites and gneisses) with low solubility minerals
(Overstreet et al. 1965). Ultisols composed of sandy clay loam saprolites dominate
the watershed (Byrd, 1972). Thus surface
and ground waters have low conductivity and low alkalinity (Lewis et al.
2007). The three surface water sample
localities were chosen from the Saluda and Reedy River Basins to represent a
characteristic range of alkalinities (high at CL01 to low at US64).
Ground water samples were collected from four wells ranging
from 5.2 to 101.8 meters deep located in the Reedy, Enoree, and Pacolet River
Basins. The localities include shallow
and deep wells chosen to represent a characteristic range of alkalinities (high
at GV W1 to low at BA W1). Locality GV W1 was chosen for depth and being
screened in bedrock. Locality SA W1 was chosen as a comparison for GV W1
because it is within 1 meter of GV W1 and is shallowly screened in saprolite.
Valley and Ridge Region Localities of
East Tennessee
The carbonate localities in the valley
and ridge area of the Lower Tennessee River Basin are characterized by
Paleozoic age carbonate rocks (Pavlicek et al. 1996).
The three carbonate surface water samples collected from sections of the North
Chickamauga Creek were chosen to represent a characteristic range of
alkalinities (high at NC02 to low at NC01).
The first locality, NC01, was chosen because it drains the carbonates of
the Newman Limestone. It is also about one mile downstream of three mines which
have contributed acid mine drainage to the system. The second locality, NC02,
drains the carbonates of the Knox Dolomite. The third locality, NC03, drains
the carbonates of the Copper Ridge Dolomite.
One sample was chosen from Douglas Lake
(DL01) in the Lower French Broad River Basin Watershed because it drains the
carbonate-cemented Tellico Sandstone and is chemically influenced by the Lenior Limestone. We chose to sample DL01 because our first
limestone sample, NC01, was influenced by acid mine drainage and did not yield
the expected alkalinity measurement.
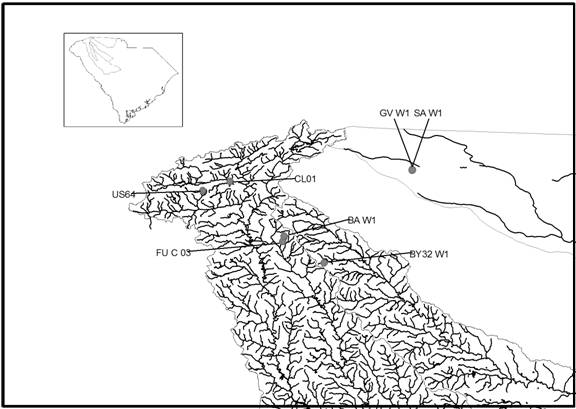
Figure
1. Map of the surface and ground
water localities sampled in the South Carolina piedmont. Surface water samples include US64, FU-C 03,
and CL01. Ground water samples include BA W1, BY32 W1, GV W1 and SA W1.
Watersheds included are the Saluda, Reedy, Enoree, and Pacolet.
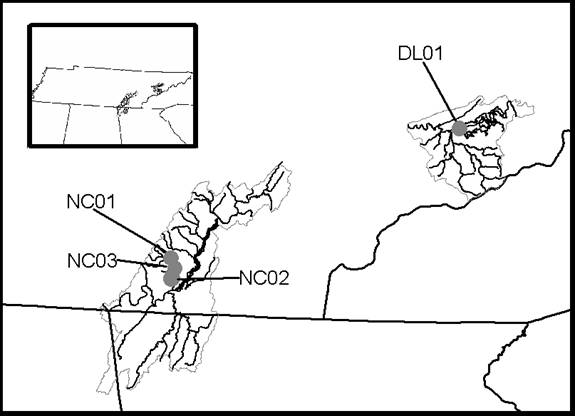
Figure
2. Map of the surface localities
sampled in the east Tennessee carbonates.
Surface water samples from the North Chickamauga Creek in the Lower
Tennessee River Basin Watershed include NC01, NC02, and NC03. The surface water sample DL01 was collected
from Douglas Lake in the Lower French Broad River Bain Watershed.
Methods
Samples
were collected from the following locations: 3 from piedmont surface waters, 4
from carbonate surface waters, and 5 from piedmont ground waters. Piedmont surface waters were chosen because
they demonstrated low, medium, or high alkalinity, known from previous
unpublished data. Carbonate surface water and piedmont ground water samples
were chosen based on field crew assumptions of the local geology’s effects on
expected alkalinity.
In
the field, surface water samples were collected in a 4L pre-cleaned,
acid-rinsed high density polyethylene bottle.
Prior to collection, each bottle was pre-contaminated three times with
the sample water and emptied downstream from the locality. A separate sample
was collected for turbidity analysis.
Groundwater samples were collected in four 500mL bottles (to be
filtered) and twelve 125mL bottles (left as unfiltered). To minimize degassing,
all samples were collected with zero headspace, either by submerging the bottle
and capping under water or filling the bottle to overflowing and then capping. pH, conductivity, dissolved oxygen, and temperature were
measured in the field with a Fisher Scientific AP62 Accumet
pH meter, YSI 30 salinity/conductivity meter and YSI 55 dissolved oxygen meter.
In
the laboratory, samples were processed using four different methods with three
replicates per method. Each method
consists of a different combination of filtering and refrigeration. Samples
were filtered through a 0.45µm membrane filter using an N2 gas
positive pressure filtration system.
Refrigerated samples were stored at 4°C in the dark for both
24-hour and timed analyses. The four
method combinations were filtered-refrigerated (FR), filtered-unrefrigerated
(FU), unfiltered-refrigerated (UR), and unfiltered-unrefrigerated (UU). The FR method functions as our control, as
this is the standard method in our research program.
Alkalinity
was measured with an Accumet AR-25 dual channel pH/
ion meter using an Accumet electrode and a Kimax 5mL buret. Sample alkalinities were measured within 24
hours and again after a storage period ranging from 17-51 days to determine the
effect of sample storage. Alkalinity was measured using the Gran Titration
method. All piedmont surface water and ground water samples and carbonate
sample NC01, were titrated with 0.02N H2SO4.
All other carbonate samples were titrated using 0.2N H2SO4.
Between 17
(Conestee Lake) and 51 (Furman Lake) days after their respective collection
dates, the unrefrigerated piedmont surface water samples were measured again to
test for time-based alkalinity concentration changes. Between 18 (Brushy Creek 2.13.07) and 50
(Bunched Arrowhead) days after their respective collection dates, all carbonate
surface water samples and sealed piedmont ground water samples were measured
again to test for time-based alkalinity concentration changes.
The
chemical analyses were run within one week of sample collection. From the original sample, an aliquot was
preserved with trace metal-grade nitric acid for cation analysis. Cation concentrations (Na+, Ca2+,
K+, Mg2+, Si4+, Fe2+) were measured
with an ICP-AES. Another aliquot was preserved with trace metal-grade sulfuric
acid for TDN analysis with an Alpkem Flow Solution
IV. One unpreserved FR sample from each locality was used to measure anions, NH4+,
and DOC. Anion concentrations (F-, Cl-,
Br-, NO3-, NO2-, H2PO4-,
SO42-) were measured with a Dionex
DX-120 Ion Chromatograph, ammonium (NH4+) with a 10-AU Fluorometer, and dissolved organic carbon (DOC) with a Tekmar Dohrmann Phoenix 8000.
Turbidity was measured the same day of collection with a LaMotte 2020 turbidity
meter. Charge balance was calculated
using the method of Freeze and Cherry (1979).
Using
SigmaStat software, two-way ANOVA tests were used to determine statistically
significant differences in the treatments of 24-hour and timed samples
independently. T-tests, Wilcoxon Rank Sum tests, and
Mann-Whitney Rank Sum tests were used to determine any statistical differences
in treatments between 24-hour and timed samples.
Equilibrium
constants were calculated using the equations of Plummer and Busenburg (1982),
and activity coefficients were calculated using the extended Debye-Huckel equation. The
ratio of PCO2 (aq) in river water to PCO2
in the atmosphere indicates the degree of CO2 supersaturation in the
river relative to the atmosphere (Piñol et al. 1992;
Huh et al. 1998). We refer hereafter to
this ratio as PCO2 saturation.
The
equation for the calculation of the partial pressure of carbon dioxide (PCO2),
which uses measurements of water temperature, pH, and HCO3-
concentration, was not modified to account for the dissolution of calcite in
our carbonate research (e.g. Neal et al. 1998b), because the waters were
undersaturated with respect to calcite (Fig.13).
Results
Piedmont
Surface Waters
Within
these sites, field pH ranged from 5.26 to 7.08 and conductivity ranged from
16.2 µS/cm (US64) to 98.9 µS/cm (CL01). The lowest dissolved oxygen content
measured was 2.7 mg/L (CL01) and the average temperature ranged from 9.14°C (CL01)
to 17.03°C
(US64)(Table 4). Ternary plots of major solutes show that
 US64 was more Na+K
rich and silicon-rich, while CL01 was more Ca-rich and almost completely
silicon-depleted, and FU-C 03 has a higher concentration of bicarbonate and was
more Ca-rich (Fig.3).
US64 was more Na+K
rich and silicon-rich, while CL01 was more Ca-rich and almost completely
silicon-depleted, and FU-C 03 has a higher concentration of bicarbonate and was
more Ca-rich (Fig.3).
The PCO2
saturation graph demonstrates that, while both lake samples FU-C 03 and CL01
had much lower PCO2 saturation levels than US64 (7 compared with
73), PCO2 saturation still demonstrated a 1:1 relationship between
24-hour and timed samples (Fig.4).
The
24-hour alkalinity ranged from about 3.5 to 32 mg CaCO3/L, as did
the timed alkalinity, also ranging from about 3.5 to 32 mg CaCO3/L
(Fig.5a,b). One timed US64 FR sample (measured 21 days
after collection) had a value of 6 mg CaCO3/ L, which when included
in two-way ANOVA and t-tests, made the results significant. The sample
alkalinity was measured again (27 days after collection) and when included in
two-way ANOVA and t-tests, it did not make the results significant. The error
was attributed to a faulty electrode.
The bicarbonate concentration ranged from about 4.5 HCO3-/L
to 38.5 mg HCO3-/L (Table 8).
When
measuring alkalinity, we asked whether 1) alkalinity varies with method, 2) alkalinity
varies with time, and 3) alkalinity varies between samples run within 24 hour
and those stored. The results of two-way
ANOVA for filtration and refrigeration between only 24-hour samples indicated
that there were no statistically significant differences. The results of
two-way ANOVA for filtration and refrigeration between only timed samples
indicated that there were no statistically significant differences. Finally, t-tests between 24-hour and timed
samples indicated that there were no statistically significant differences
between any of the treatment methods for Piedmont surface waters (Table 6).
A
comparison of 24-hour to timed alkalinity measurements demonstrates that, while
both lake samples FU-C 03 and CL01 had much lower alkalinity measurements than
US64, a 1:1 relationship between 24-hour and timed measurements still exists,
suggesting no change in alkalinity over time (Fig.6).
A charge
balance graph shows the range to be ±10% for 24 hour samples and ±12% for
stored samples (Fig.7). These poor charge balances can be attributed to the low
alkalinity and conductivity of these headwaters. T-tests between 24-hour and
timed samples indicated that there were no statistically significant
differences between any treatment methods for US64 and FU-C 03. A Mann-Whitney Rank Sum test indicated that
there were no statistically significant differences between any treatment
methods for CL01 (Table 7).
Figure 3. Ternary
plot illustrating the variation in hydrochemical
facies in the waters sampled. Notice that FU-C 03 had a higher concentration of
bicarbonate and was more Ca-rich, US64 was more Na+K
rich and silicon-rich, and CL01 was more Ca-rich and almost completely
silicon-depleted.
Figure 4. A
comparison of the PCO2 saturation levels of 24-hour samples versus
timed samples demonstrates a 1:1 relationship, suggesting no change in PCO2
saturation over time.
Figure 5a,b. Both graphs
demonstrate the range of alkalinity (mg CaCO3/L) of 24-hour and
timed samples in Piedmont surface waters collected between October 2005 and
March 2006. None of the 24-hour or timed samples demonstrated any statistically
significant differences.
Figure 6. A
comparison of the alkalinities of 24 hour samples versus timed samples
demonstrated a 1:1 relationship between the measurements, suggesting no change
in alkalinity over time.
Figure 7. Range of charge balance for 24 hour and timed samples, illustrating
our confidence in the alkalinity measurements. 24-hour and timed samples
were both within ±12%. There is no explanation for individual localities’
charge balances being consistently negative or positive.
Carbonate
Surface Waters
Within
these sites, field pH ranged from 5.85 to 9.15 and conductivity ranged from 56 µS/cm (NC01) to 217.3 µS/cm (NC02). The lowest
dissolved oxygen content measured was 5.91 mg/L (NC03) and the average
temperature ranged from 21°C (NC03) to 30.27°C (DL01)(Table 4). In contrast to piedmont surface water, the
ternary plots of major solutes in carbonate surface waters showed that all four samples were Ca-rich and Na+K, Mg,
and silicon depleted and all but NC01 had a high bicarbonate concentration.
NC01 had a higher concentration of Cl+SO4 due to the influence of
acid mine drainage. NC02 and NC03 were both underlain by dolomite and had
almost the same concentration of bicarbonate (Fig.8)
The PCO2
saturation graph demonstrates that, while both samples underlain by dolomite
had much higher PCO2 saturation levels than DL01 or the acid mine
drainage influenced NC01 (0.11 compared with 17), PCO2 saturation
still demonstrated a 1:1 relationship between 24-hour and timed samples
(Fig.9).
The
24-hour alkalinity ranged from about 0.80 to 130 mg CaCO3/L, while
the timed alkalinity ranged from about 0.20 to 110 mg CaCO3/L
(Fig.10a,b). One
24-hour NC03 FR sample had a value of 156.16 mg CaCO2/L, which when
included in two-way ANOVA and t-tests, made the results significant. When the
sample was not included in these statistical tests, the results were not
statistically significant. The error was
attributed to bottle contamination. The
bicarbonate concentration ranged from about 0.7 HCO3-/L
to 133 HCO3-/L (Table 8).
The
results of two-way ANOVA for filtration and refrigeration between only 24-hour
samples indicated that there were some statistically significant differences.
The results of two-way ANOVA for filtration and refrigeration between only
timed samples indicated that there were some statistically significant
differences. Finally, t-tests and a Wilcoxon Rank Sum test between 24-hour and timed samples
indicated that there were some statistically significant differences between
filtration and refrigeration in carbonate surface waters (Table 6).
A
comparison of 24-hour to timed alkalinity measurements demonstrates that, while
both samples underlain by dolomite had higher alkalinity than DL01 or the acid
mine drainage influenced NC01, a 1:1 relationship between 24 hour and timed
measurements still exists, suggesting no change in alkalinity over time
(Fig.11).
A charge
balance graph shows the range to be ±10% for 24-hour samples and ±8% for stored
samples with
the one 24-hour NC03 FR sample at about -20% (Fig.12). T-tests between 24-hour
and timed samples indicated that there were no statistically significant
differences between any treatment methods for DL01. Mann-Whitney Rank Sum tests indicated that
there were no statistically significant differences between any treatment
methods for NC01, NC02, and NC03 (Table 7).
The
calcite saturation graph indicates that none of the localities sampled were
supersaturated with respect to calcite, although several carbonate surface
water samples were close to saturation (Fig.13).
Figure 8.
Ternary plot illustrating the variation in hydrochemical
facies in the waters sampled. Notice that all four carbonate samples were
Ca-rich, Na+K, Mg, and silicon depleted and all but
NC01 had a high bicarbonate concentration. NC01 had a higher concentration of
Cl+SO4 due to the influence of acid mine drainage. NC02 and NC03 were both
underlain by dolomite and had almost the same concentration of bicarbonate.
Figure 9. A
comparison of the PCO2 saturation levels of 24 hour samples versus
timed samples demonstrates a 1:1 relationship, suggesting that there is no
change over time. Notice that DL01 had almost no PCO2 saturation,
suggesting that the water was nearly at equilibrium with the atmosphere.
Figure 10a,b. Both graphs
demonstrate the range of alkalinity (mg CaCO3/L) of 24-hour and
timed samples in carbonate surface waters collected between July and August
2006. Depending on the treatment method, some samples demonstrated
statistically significant differences, indicating changes in alkalinity
dependent on treatment method.
Figure 11. A
comparison of the alkalinities of 24 hour samples versus timed samples
demonstrated a 1:1 relationship between the measurements, suggesting no
meaningful change in alkalinity over time.
Figure 12. Range of
charge balance for 24-hour and timed samples, illustrating our confidence in
the alkalinity measurements. 24-hour and timed samples were
both within ±10%, except for the one 24-hour NC03 FR sample at
about ---20%.
Figure 13. This
calcite saturation graph with error ranges demonstrates that none of the
samples in this study were oversaturated with respect to calcite. For this
reason, we did not need to account for the effects of calcite precipitation.
Piedmont
Ground Waters
Within
these sites, field pH ranged from 4.9 to 7.74 and conductivity ranged from 32.47 µS/cm (SA W1) to 118.2 µS/cm (GV W1). The lowest
dissolved oxygen content measured was 2.27 mg/L (GV W1) and the average
temperature ranged from 12.1°C (BY32 W1 2.13.07) to 19.47°C (GV W1)(Table 4). Ternary plots of major solutes show that BY32 W1 11.30.06, BY32 W1 2.13.07, and SA W1
were more Na+K rich.
All of the samples but BY32 W1 2.13.07 were bicarbonate rich with GV W1
being almost completely composed of bicarbonate. All of the samples were
silicon depleted (Fig.14). During storage,
the BY32 W1 samples began to precipitate Fe2+. Significant amounts were detected when these
samples and SA W1 were re-tested for Fe2+.
The PCO2
saturation graph demonstrates that, while all of the groundwater samples had
much lower PCO2 saturation levels than BA W1 (3.1 compared with
306), PCO2 saturation still demonstrated a 1:1 relationship between
24-hour and stored samples (Fig.15).
The
24-hour alkalinity ranged from about 6 to 60 mg CaCO3/L, while the
timed alkalinity similarly ranged from about 8 to 59 mg CaCO3/L
(Fig.16). The electrode broke in one
24-hour SA W1 FU sample, and the sample was re-measured about one hour after
the bottle was initially opened. The
bicarbonate concentration ranged from about 8.5 HCO3-/L
to 73 HCO3-/L (Table 8).
The
results of two-way ANOVA for filtration and refrigeration between only 24-hour
samples indicated that there were no statistically significant differences. The
results of two-way ANOVA for filtration and refrigeration between only timed
samples indicated that there was one statistically significant difference in
the SA W1 sample. Finally, t-tests and a
Mann-Whitney Rank Sum test between 24-hour and timed samples indicated that
there were some statistically significant differences between filtration and
refrigeration in piedmont ground waters (Table 6).
A
comparison of 24-hour to timed alkalinity measurements suggests that these are
very complicated systems. Three
groundwater localities demonstrated a 1:1 relationship between 24 hour and
timed measurements, suggesting no change in alkalinity over time. The locality
BY32 W1, sampled twice, does not fit this 1:1 line, suggesting that there may
be some change in alkalinity over time (Fig.17).
A charge
balance graph shows the range to be ±10% for 24-hour and timed samples with the outlying 24-hour
BY32 W1 samples between -10% and -20% and the SA W1 samples between -5% and
-15% (Fig.18). T-tests between 24-hour and timed samples indicated that there
were some statistically significant differences between treatment methods. A Mann-Whitney Rank Sum test indicated that
there were some statistically significant differences between treatment methods
(Table 7). Charge balances for both of the BY32 W1 samples and SA W1 were found
to improve between 3.92 μmeq/L (BY32 W1 11.30.06)
and 0.13 μmeq/L (SA W1) when Fe2+ was accounted for in the charge balance.
Figure 14. Ternary plot illustrating the variation in hydrochemical
facies in the waters. Notice that three of the samples are Na+K rich and that all but BA W1 have
a high bicarbonate concentration.
Figure 15. A
comparison of the PCO2 saturation levels of 24-hour samples versus timed
samples demonstrates a 1:1 relationship, indicating that there is no change in
pCO2 saturation over time.
Figure 16a,b. Both graphs
demonstrate the range of alkalinity (mg CaCO3/L) of 24-hour and
timed samples in Piedmont ground waters collected between November 2006 and
March 2007. Depending on the treatment method, some samples demonstrated
statistically significant differences, indicating that there is no change in
alkalinity dependant on treatment method.
Figure 17. A
comparison of the alkalinities of 24 hour samples versus timed samples
demonstrated a 1:1 relationship between the measurements of three ground
water localities, suggesting no change in alkalinity over time. The locality
BY32 W1, sampled twice, does not fit this line, suggesting that there may be
some change in alkalinity over time.
Figure 18. Range of charge balance for 24 hour and timed samples, illustrating
our confidence in the alkalinity measurements.
24-hour samples were within ±20% and timed samples were within ±15%.