An
Analysis of Snow Depth and Solar Radiation using
Snow
Data Assimilation System
Background/Motivation
The primary motivation behind this project was to
gain more experience and practice with remote sensing snowpack distribution
tools in order to help develop my interests in snow hydrology. The trends in forecasting water availability
from snow is shifting rapidly towards remote sensing applications. Snowpack storage is one of the primary sources
of water for downstream uses. With land
use changes coupled with climate change, gaining a more detailed understanding
of the spatiotemporal extent of snow is important to better forecast snowmelt
derived water volumes.
Methods
The
National Snow and Ice Data Center (NSIDC) works with the NOAA National Weather
Service's National Operational Hydrologic Remote Sensing Center (NOHRSC) to
archive output from their SNOw Data Assimilation
System (SNODAS) model. SNODAS is a
modeling and data assimilation system which was developed to estimate the snow
cover and associated variables to support hydrologic modeling accuracy and
analysis. The aim of SNODAS is to
provide a physically consistent framework to integrate snow data from satellite
and airborne platforms and ground stations with model estimates of snow cover
(Carroll et al., 2001). 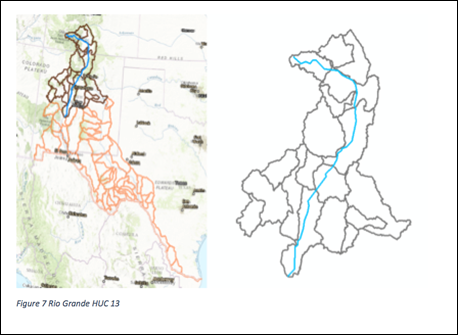
Figure 1 Upper Rio Grande Basin
Results
For
the image below the measured snow depth at each SNOTEL station was compared to
the modeled output of SNODAS. Each model
that was produced by SNODAS fell within range of each SNOTEL site given the
dates chosen. The large scale and range
makes it easier to fit the range of snow depths into the area, but it still
seems like there is enough resolution to make distinctions geographically about
the location of the SNOTEL stations and the depths recorded at the site and the
data output from SNODAS.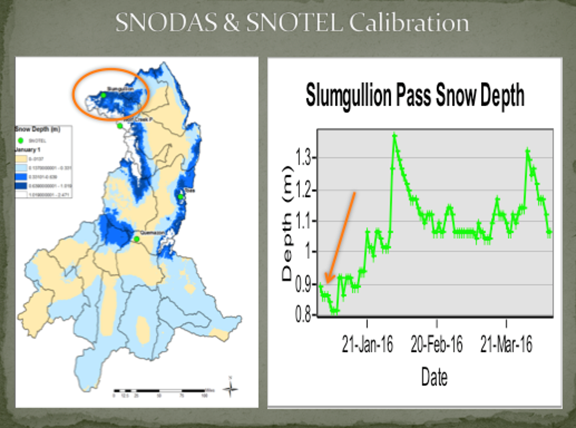
Figure 2
SNODAS Forecast vs SNOTEL Data
Snow Melt and Solar Radiation
The
next aspect that was evaluated was the relationship of snow melt data to the solar
radiation model that was applied to this area.
As solar radiation increased with the day of the year snowmelt
increased. January 31 was the start of
the sustained high pressure period during the 2015/2016 winter. Melt generation was widespread during this
day below. 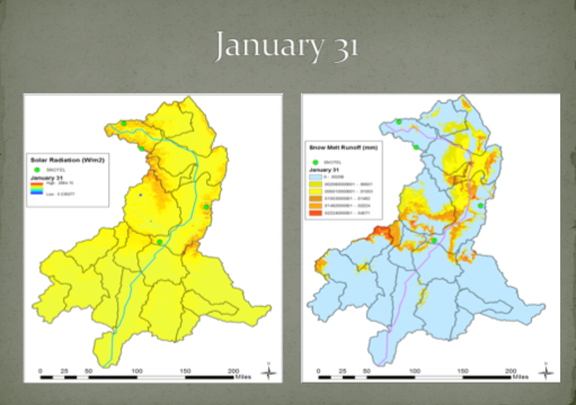
Figure 3 Solar Radiation vs Snowmelt Forecast
Future Work
Additional work is needed using the Solar Radiation tool as currently I did not apply any vegetation type to adjust for solar radiation incident to the land surface. The solar radiation would certainly be different if there was forest canopy applied to the model. Additional work also needs to be done for the use of the SNODAS depth data to gain a better understanding of the accuracy of the forecasts. I would need to conduct comparisons of depth data over all years that the data is available in order to gain an understanding of how accurate the forecasts are and under what conditions SNODAS performs best.