Table of Contents
Product Recalls Quantification and Analysis
Quantification of 1997 recalls
Childrens Products
Monthly and Seasonal Recall Trends
The Government Role In Recalls
Conclusion
References
1997 PRODUCT RECALLS: QUANTIFICATION AND ANALYSIS
The present study categorizes consumer product recalls into six categories, and a final, miscellaneous grouping. The six main recall categories are: 1) children's products; 2) motor vehicles; 3) appliances and tools; 4) perishables; 5) furniture/computer; and 6) sports and recreation.
Based upon previous use of this typology (Gibson, 1997; Gibson, 1998), we extend these recall analyses by quantifying the same categories, and seeking the same monthly and seasonal correlations. In addition, the present study also compares the incidence of government-ordered vs. relatively voluntary recalls.
1997 recall amounts and patterns differ little from the 1996 quantification. Recalls occur frequently; there were 2,447 recalls in 1997 (an average of 6.70 each day, or almost 47 per week). Some months see relatively little recall activity compared to others, and there appears to be a modified seasonal variable at work. The incidence of government-ordered recalls compared to voluntary recalls varies from recall category to category; there is no apparent pattern.
Product recalls of consumer goods in the United States tend to reflect certain
qualitative and quantitative patterns. They generally involve relatively serious product
problems, likely to result in serious consumer injury or death if recall warnings are not
heeded. They occur often; at last five times a day, on average, in 1996 (Gibson, 1998,
773). And, they seem to occur more often at some times of the year than others, in what
has been termed a "modified seasonal" variable (Gibson, 1998; 774-5).
In 1997, American recalls overall did not vary much from these typical tendencies.
Comparisons between 1996 and 1997 reveals consistent similarities between the two
years. However, a series of four unusually widely publicized 1997 recall events may
change the recall regulatory environment for years to come.
The year 1997 began with two bizarre product recalls, one relatively unpublicized
and another, far better known situation. In January, the state of Maryland recalled 78
special license plates featuring the Confederate flag, taking them from the Sons of
Confederate Veterans after Black political leaders in Maryland complained ("Maryland
Recalls...," 1997, A-3). That same month, the nationally-publicized "hair-eating doll"
recall occurred.
Mattel voluntarily recalled 500,000 "Cabbage Patch Kids Snacktime Kids" dolls on
January 6 because, as Consumer Reports put it, "When doll simulates chewing action,
child's hair or fingers could get caught in child's mouth" (1997, 45). The Associated Press
noted "about 100 reports of children getting their hair and fingers caught in the dolls
mouths" on January 7 ("Mattel to Reimburse...," 1997, D-5). Syndicated newspaper
humor columnist Dave Barry joked about the recall in his popular nationally-published
column, joining late night talk show hosts Jay Leno and David Letterman in a comic salute
to this national event.
As summer turned to fall, another sensational recall caught national attention. Los
Angeles Superior Court Judge Robert H. O'Brien "ordered the publishers of Playgirl
magazine to recall its August issue because it contains nude photographs of [Brad] Pitt
and his former girlfriend, lawyers for both sides said" (O'Neill, 1997, B-3). The
Associated Press added that "The photos show Pitt and [Gwyneth] Paltrow, who at one
time had been engaged, frolicking in the nude outside a hotel bungalow on a Caribbean
island two years ago" ("Playgirl Told...," 1997, A-3).
Two serious recall events transpired in September and October, as the Hudson
beef recall and the Redux and Pondamin weight loss drug recall claimed public attention
and media interest. Unlike the alleged man-eating doll and the prurient Pitt photographs,
these recalls involved consumer death and injury caused by a product. The FDA recalled
Redux, and Pondamin, on September 15, after separate studies conducted by the Mayo
Clinic and the FDA discovered that "after taking the pills, about a third were newly
diagnosed with valve damage" (Neergaard, 1997; A-1, A-8).
American Home Products Corporation, marketer of the diet drugs, disputed the
FDA's medical claims and recall action; on October 31, The Wall Street Journal reported
that "doctors at 21 other medical centers across the country say they're finding a far lower
incidence of valve problems. The doctors performed tests on nearly 750 patients after the
recall of Redux and Pondimin was announced, and they found possible valve leaks in just
57 of them--a rate of only 8%" (Langreth and Johannes, 1997, B-1).
It appears, in hindsight, that American Home Products Corporation may have been
justified in its skepticism regarding this recall. The New England Journal of Medicine
reported on three recent studies; the consensus was that the FDA had overestimated the
risk posed by the diet drugs ( "Redux May Be...," 1998, A-6).
At the same time that these diet drugs were being recalled, the Hudson Food
Incorporated was facing a devastating beef recall. Originally begun as a voluntary recall of
20,000 pounds of ground beef on June 4, Hudson eventually recalled 25 million pounds of
ground beef under FDA supervision (Glanton, 1997, D-7). By August 22, some Hudson
facilities were beginning to cease operations and close their doors ("Hamburger Recall...,
1997, A-3).
The present study seeks to advance our understanding of product recalls, by
quantifying the incidence of 1997 recalls in seven categories; 1) children's products,
2) motor vehicles, 3) appliances and tools, 4) perishables, 5) office, furniture, and
computer goods , 6) sports and recreation items, and 7) miscellaneous. In addition, we
will search for monthly and seasonal trends in recall frequency, and compare governmental
vs. voluntary recalls. Relying primarily on regulatory agency data, and supplemented by
Consumer Union publications and computer searches of periodicals, this paper presents
the clearest, most comprehensive picture available of the state of product recalls in the
U. S. in 1997.
return to index
QUANTIFICATION OF 1997 RECALLS
Using Gibson's (1997) typology of the categories of product recalls, it is possible
to ascertain the number of recalls of any one type, to appreciate trends in recall frequency
and/or timing, and to make intra-category and inter-category comparisons. In this section,
we will quantify the occurrence of recalls in each of the seven categories of recall. There
were 2,447 recalls in 1997; that amounts to 6.70 per day, or 46.90 each week
return to index
Children's Products
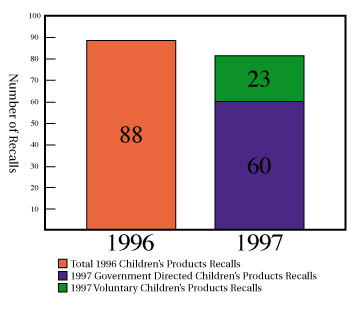
There are typically many recalls each year of children's products. 1997 was no
exception, as there were at least 83 recalls of children's items, involving more than 17
million product units; the year before that, there were 88 such recalls. Sixty of these recalls
were governmentally-directed, while another 23 were classified as voluntary. See Table
One.
One reason for the large number of children's product recalls is that people are
protective of children, and are careful to check products. In addition, there is a large
number of sub-categories of children's products subject to being recalled. In the 1996
study, we posited 13 children's product sub-categories; this year there were 23.
 return to index
Motor Vehicles
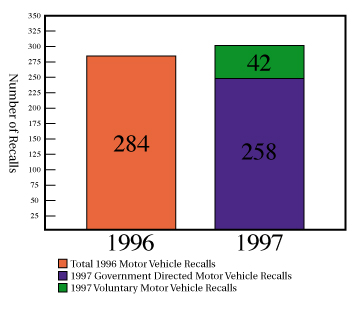
Motor vehicles, like children's products, are frequently recalled. In fact, these are
the second and third-most frequently occurring types of recalls, after perishables. In 1997,
there were approximately 300 motor vehicle recalls; an increase from the 284 motor
vehicle recalls the year before. There were 258 governmentally-conducted recalls of
motor vehicles in 1997, compared to 42 such recalls not involving a government agency.
See Table Two.
 return to index
Appliances and Tools
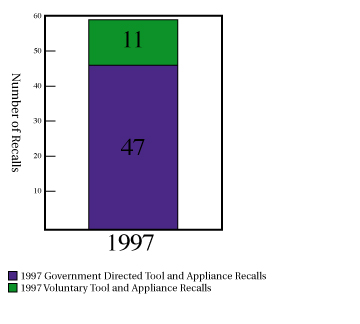
There were not as many individual recall campaigns of appliances or tools, but
several of them involved substantial numbers of products. In fact, although there were
only 58 appliance and tool recalls (47 by the government, eleven voluntary), compared to
83 children's products and 300 motor vehicle, six million fewer children's product units
and motor vehicles were recalled. Nearly 45 million product units of appliances and tools
were recalled, compared to 17,131,682 children's product units and 21,685, 925 motor
vehicle items. 1997 appliance and tool recall data is presented in Table Three.
 return to index
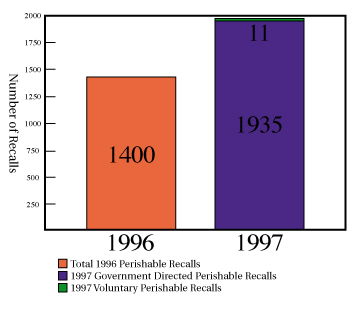
Perishables
By far the most numerous type of product recall, there were 1946 perishables
recalls in 1997. In 1996, there were just over 1,400 perishable recalls, involving more than
1.7 billion product units. There was a greater number of such recalls in 1997, but a
substantially smaller number of units was recalled. The government acted directly in 1935
of the 1997 recalls, while another eleven were voluntary.
In 1997, there were 296 recalls of foods, 223 of medicine, thirteen of clothing,
and 1,017 of biologicals, to cite four of the seven sub-categories. See Table Four.
 return to index
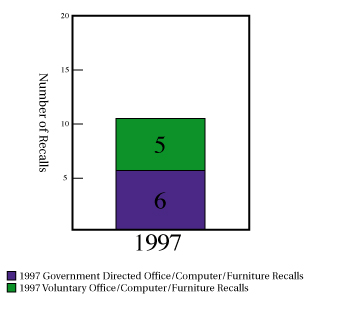
Office/Computer/Furniture
This was the least frequently recalled type of product in 1997, compared to the
other five main categories. There were only 11 such recalls, of 12, 789, 500 product units.
Six of these recalls were ordered by a government agency, while the other five were not.
See Table Five.
 return to index
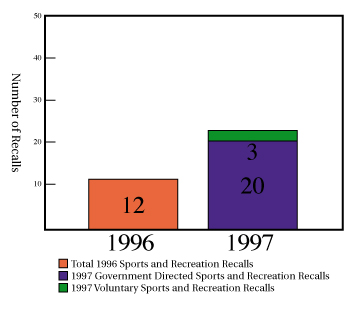
Sports and Recreation
There were 23 recalls of sports and recreational equipment in 1997, nearly twice as
many as the 12 sports and recreation recalls the year before. And, while the twelve 1996
sports and recreation recalls netted under 500,000 product units, the 1997 sports and
recreation recalls involved more than 2,000,000 product units. Three of these
recalls were considered voluntary, with direct government action in 20 cases. See
Table Six.
 return to index
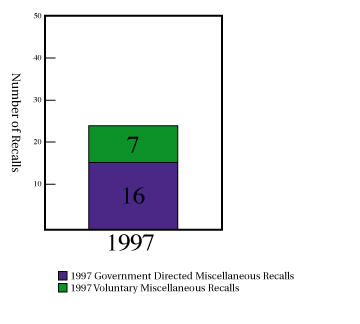
Miscellaneous Product Recalls
In addition to the six main recall categories, there is a catch-all category, one
containing all of the products not included in one of the other six. In 1997, there were at
least 23 of these recalls, involving nearly 6.5 million product units; 16 miscellaneous
recalls involved a government agency, while seven did not. See Table Seven.
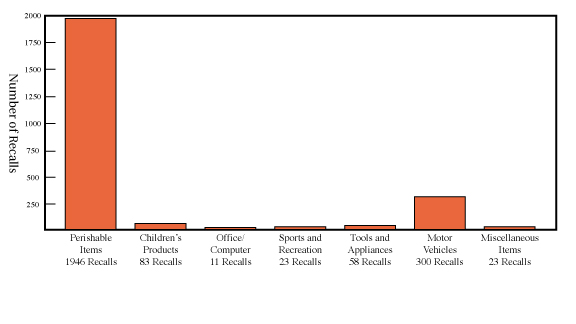
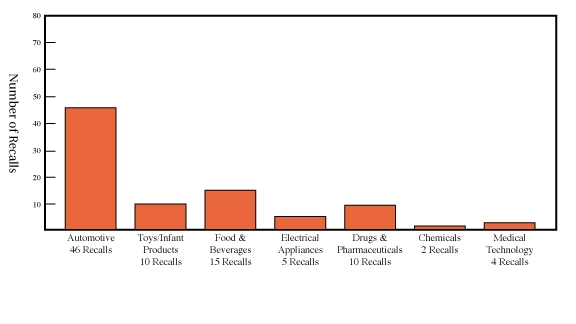
At this point, we have quantified the incidence of each type of recall. Table Eight
presents a summary of the number of 1997 recalls, and the number of product units
recalled. See Table Eight.
 return to index
MONTHLY AND SEASONAL RECALL TRENDS
Although complete information on each recall is not available, we do know enough
about most to determine basic facts; the name of the recalled product, the date of recall,
the number of units involved, and the reason for the recall are usually available. If it is
possible to anticipate rather than react to recall events, it might be possible to minimize
the expense and other unpleasant consequences of recall campaigns. Identifying possible
monthly and seasonal trends in recall occurrences is a first step in such anticipation. The
present study extends Gibson's (1998) analysis of monthly and seasonal recall tendencies,
which found three distinct clusters of high-recall, moderate, and low-recall periods.
The monthly incidence of product recalls is illustrated in Table Nine.
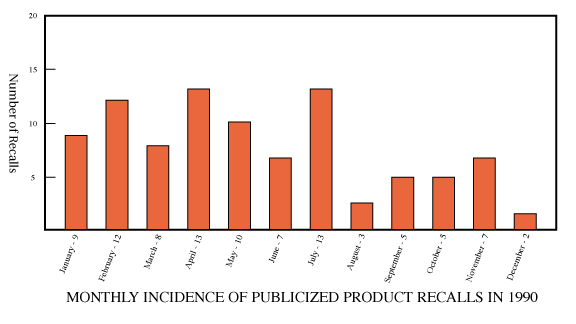
Initial observation of the monthly distribution of recalls in 1997 reveals no surface
patterns, only the obvious fact that some months have more recalls than others. However,
just as was the case with 1996 recalls, these seemingly random monthly distributions make
sense when combined into seasonal cluster patterns.
return to index
THE GOVERNMENT ROLE IN RECALLS
To this point, we have considered the number of recalls in the main categories, and
tabulated the number of individual product units recalled. Monthly recall tendencies were
noted, and quasi-seasonal recall frequency variations were observed. Let us now add a
final dimension to our understanding of 1997 recalls: the role of government.
Tables one through seven summarized the number of recalls in the various
categories, and indicated the number of directly governmentally-induced recalls and those
recalls termed purely voluntary on the part of recallers. Now we can directly compare the
number of governmental vs. non-governmental recalls, looking at both the number of
campaigns and number of recalled units. That comparison is provided in Table Ten.
The results are inconsistent, although in general there are many more
governmentally-induced recalls. There was rough parity between the six government
office/furniture/computer recalls, and the five non-governmental recalls. But, in general,
there were far more recalls initiated by the government, by a margin of 2,525 to 122.
These governmentally-induced recalls are produced by several regulatory agencies,
most notably the Food and Drug Administration, the National Highway Traffic Safety
Administration, and the Consumer Product Safety Commission. Other 1997 federal
recallers included the U. S. Department of Agriculture, and the Centers for Disease
Control.
return to index
CONCLUSION
It is important to advance our understanding of product recalls, in light of the
gravity of the consequences of ineffective recall campaigns. It is no overstatement to
suggest that product recalls are a matter of life and death; effective recalls save lives and
reduce suffering, while unsuccessful campaigns may have quite different and disappointing
results.
1997 recalls differed little from recall tendencies of the years before. Recalls of
perishables far outnumbered the rest. There was a significant number of children's
products and motor vehicle recalls, with a fewer number of appliances and tools, office,
computer and furniture, and sports and recreation product recalls.
Monthly variation in recall frequency was considerable, with no apparent pattern.
However, certain seasonal tendencies were identified. These quasi-seasonal 1997 recall
frequency tendencies are quite similar to the 1996 recall data, and not much different than
the 1995 recall profile.
Much remains to be learned about American product recalls. We know little about
sub-national recalls; counties, cities, and states sometimes conduct recall activity. At the
federal level, it is likely that some recall activity has escaped our attention. Thus, we must
concede that our quantification of 1997 recalls is probably an understatement of the true
incidence of this economic phenomenon.
Nevertheless, there is considerable value in enhancing our understanding of
product recalls in the U. S. In light of the public health and economic consequences of
product recall events, it is imperative that we advance our knowledge about this important
business topic, with its central communication variables.
return to index
REFERENCES
Associated Press. (1997, January 7). Mattel to reimburse for hair-eating dolls.
Albuquerque Journal, p. D-5.
Cabbage Patch Kids Snacktime Kids doll. (1997, March). Consumer Reports. p. 45.
Gibson, D. C. (1997). Consumer product recalls 1995: A typology and quantification. In
J. Biberman and A. Alkhafaji (eds) Business Research Yearbook
Lanham, MD: University Press of America, pp. 777-81 (1998).
Quantification and analysis of 1996 recalls. In J. Biberman and
A. Alkhafaji, (eds) Business Research Yearbook Lanham, MD: University
Press of America, pp. 771-75.Glanton, E.
.Meatpackers rethink `reworking' Albuquerque
(1997, August 28)
Journal, p. D-7.
Hamburger recall grows: Plant shut. (1997, August 22). Albuquerque Journal, p. A-3.
Langreth, R., and L. Johannes. (1997, October 31). Diet-drug mystery grows as new data
emerge. The Wall Street Journal, p. B-1.
Neergaard, L. (1997, September 16). FDA pulls diet drugs off shelves. Albuquerque
Journal, p. A-1.
O'Neill, A. (1997, August 8). Judge orders recall of magazine over nude photos. Los
Angeles Times, p. B-3.
Playgirl told to halt mags. (1997, August 8). Albuquerque Journal, p. A-3.
Redux may be less risky than feared. (1998, September 10). Albuquerque Journal, p. A-6.
return to index
|