Homework
1: Creating a Web Page and Navigating in ArcMap and ArcCatalog.
I wanted to explore the Pacific Crest Trail while getting to
know ArcGIS. I added a variety of layers available on ArcGIS Online that
represented the regions of the trail, the trail itself, and the mile marker
points. Below is a brief summary of how I manipulated the layers, adjusting the
symbology and lables.
Figure 1: Display of the Pacific Crest Trial
map layers—regions, and trail line shapefiles.
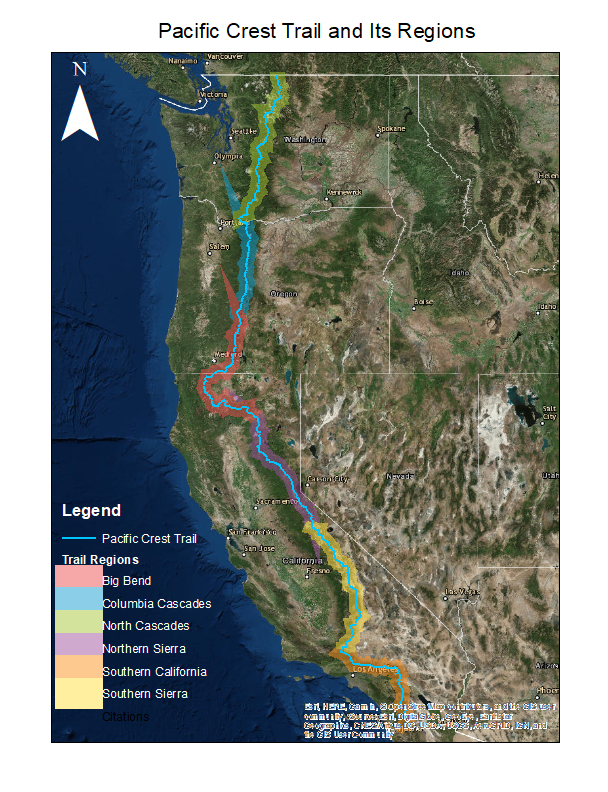
Figure 2: Zoomed in, 1:37,482 scale, displaying the opaque region,
trail line, and mile marker points. This view shows the PCT crossing the
Columbia River from Oregon to Washington.
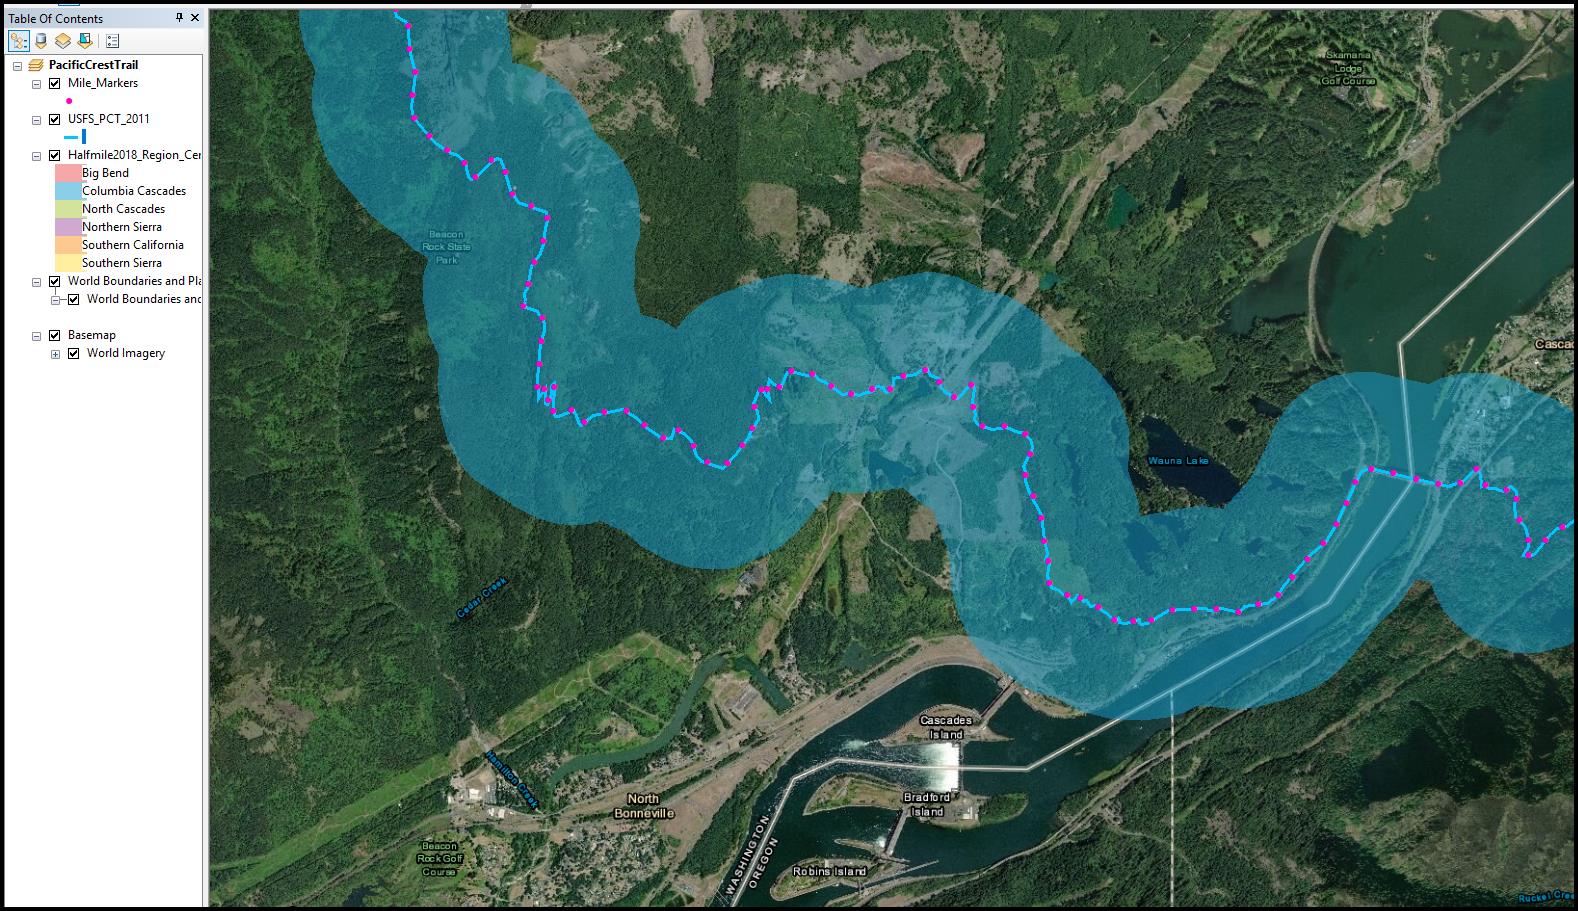
Figure 3: I catagorized the mile markers,
giving various ranges of miles different colors.
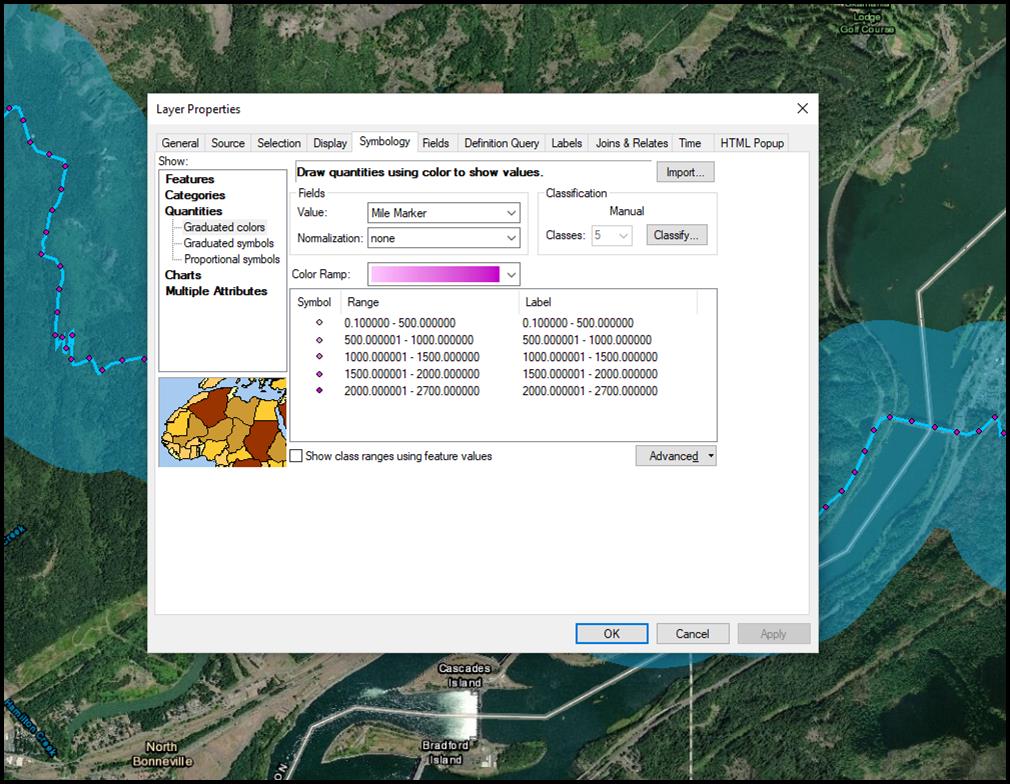
Figure 4: Shows the color change between two
catagories in the mile markers layer.
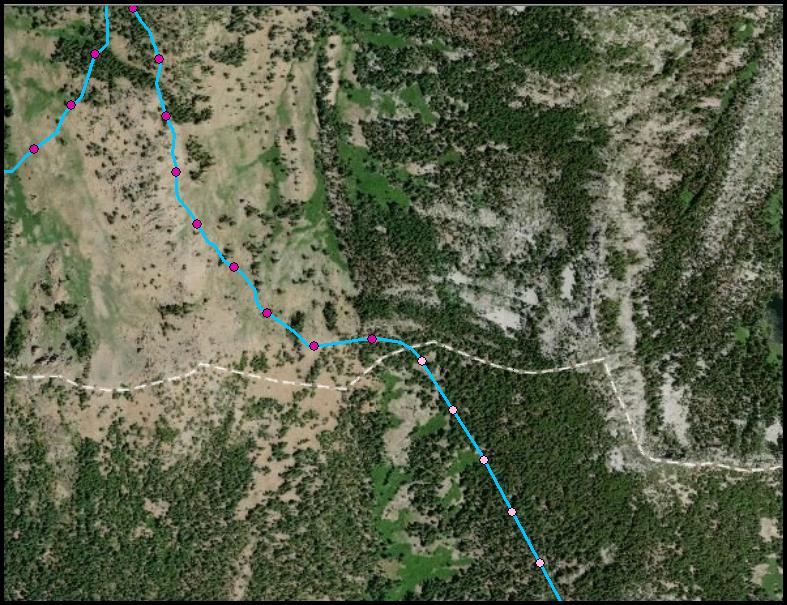
Figure 5: Using “select by attribute” I
selected points that represented every 1 mile and every 10 miles. I created a
new layer from each selection.
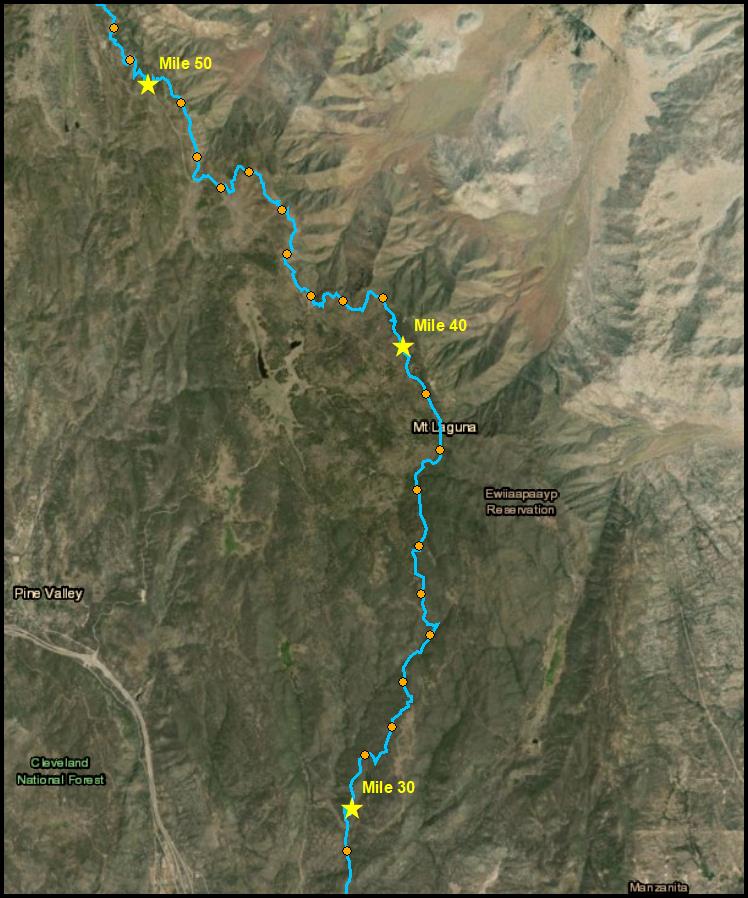
Below is a screen shot showing the different
symbology and intervals. Orange circles are every mile, yellow stars are every
10 miles.