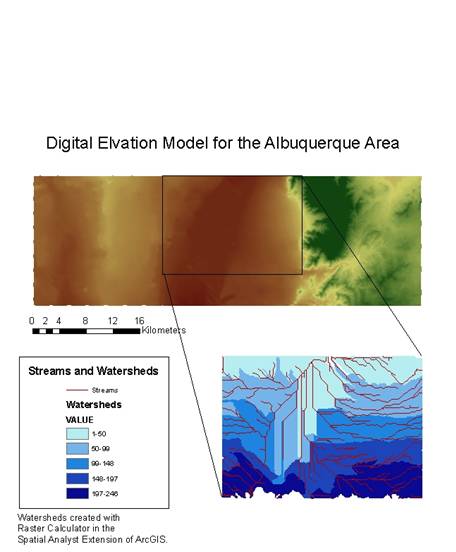
After downloading the 3 files from the RGIS website they were imported into ArcMap using the ArcToolbox to convert them into a DEM. They were combined with the mosaic function of the raster calculator in the Spatial Analyst toolbar. After this I used the fill function to remove all the sinks in the DEM to create a depressionless DEM. Various hydrologic modeling functions were also carried out on the DEM to determine flow direction and flow accumulation. The remaining functions were carried out on a smaller portion of the DEM. I chose to focus on the north central portion of the DEM as it has a large number of streams with > 1km drainage area. For my final map I chose to show the Albuquerque DEM in a color scheme that would allow the viewer to differentiate changes in elevation. For the north-central portion I chose to show a magnified view showing all streams with >1km of drainage area and portrayed the various watersheds in shades of blue.