Contact info
Kateryna Artyushkova
Research Associate Professor
Associate Director for CEET
Department of Chemical and Nuclear Engineering
The University of New Mexico
(505) 277-0750

News
Patent "Method for Multivariate Analysis of Confocal Temporal Image Sequences for Velocity Estimation'U.S. Patent 8,045,140, issued October 25, 2011 was awarded at 2012 STC.UNM Creative Awards Ceremony
Uploaded a new GUI for calculating 1st and 2nd order statistics from images onto Matlab file exchange website
Links
Department of Chemical at Nuclear Engineering at UNM
Center for Emerging Energy Technologies
Center for Micro-Engineered Materials
Surface analysis (XPS) facility at CMEMMultivariate Surface Analysis
IS
FAST, LABEL-FREE DETECTION OF VIRUSES, TOXINS OR EVEN DNA FRAGMENTS
POSSIBLE IN NANOCHANNELS?
Fluids confined in nanometer-sized structures exhibit physical behaviors not observed in larger structures, such as those of micrometer dimensions and above, because the characteristic physical scaling lengths of the fluid very closely coincide with the dimensions of the nanostructure itself. For example, confinement of molecular transport in fluidic channels with transport-limiting pore sizes of nanoscopic dimensions gives rise to unique molecular separation capabilities. Suchnanofluidic structures are used widely for separating fluids with disparate characteristics. Development of bio-nanofluidic technology for chip-based analysis systems gives possibility of investigating DNA behavior at the single-molecule level.
Various molecular separation techniques such as nanochannel electrophoresis, microchannelcapillary electrophoresis and gel electrophoresis rely on difference between velocities of movement of molecules due to various sizes, charges or combination of those. After sufficient time has passed, clearly visible bands of separated molecules are observed using various possible detection schemes.
Think about two fishes moving down the stream. If they look identical and weigh the same, how do we know if any of them have eaten another small fish for dinner? And that is very important question, believe me! The only way to answer it is to take your stopwatch and wait for both fishes to swim down the stream far enough so that the difference in velocities becomes apparent depending on time sensitivity of your stopwatch.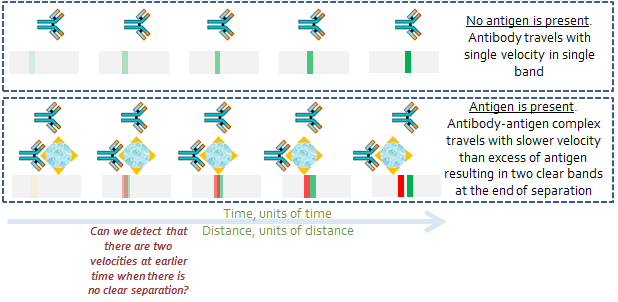 If two of the molecules separated are
fluorescently labeled with different dyes they can be images by fluorescent
microscopy. This is shown in the example below where model receptor/toxin system has been separated
by Capillary Electrophoresis.
If two of the molecules separated are
fluorescently labeled with different dyes they can be images by fluorescent
microscopy. This is shown in the example below where model receptor/toxin system has been separated
by Capillary Electrophoresis.
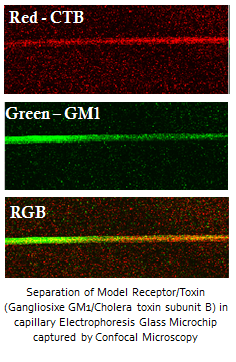
Green-labeled GM1 is forming a complex with red-labeled CTB and moves slower than excess of unbound GM1. Clear green band of GM1 is followed by orange band of the complexed receptor/toxinmixture confirming the presence of toxin in the system.
This is a main principle of using separation assays for detection purposes of various viruses, toxins, etc. The problem with all these detection systems that they often must involve labeling of analytes and binding agents with dyes, and sometimes it may take long time to see clearly separated bands to be certain that the analyte is present. Two different flow velocities as shown in example with fishes are either obvious from visual analysis of images (observing clear separate bands) or can be determined by manual calculations from images as a function of time of separation, which is tedious, time-consuming and quite subjective process dependent on the analyst doing the calculations.
This is where patent ”Method for multivariate analysis of confocal temporal image sequences for velocity estimation” comes handy. It allows identifying whether there are two flow velocities present in images acquired as a function of time of separation from the way intensities of images themselves change with time.
Fluids confined in nanometer-sized structures exhibit physical behaviors not observed in larger structures, such as those of micrometer dimensions and above, because the characteristic physical scaling lengths of the fluid very closely coincide with the dimensions of the nanostructure itself. For example, confinement of molecular transport in fluidic channels with transport-limiting pore sizes of nanoscopic dimensions gives rise to unique molecular separation capabilities. Suchnanofluidic structures are used widely for separating fluids with disparate characteristics. Development of bio-nanofluidic technology for chip-based analysis systems gives possibility of investigating DNA behavior at the single-molecule level.
Various molecular separation techniques such as nanochannel electrophoresis, microchannelcapillary electrophoresis and gel electrophoresis rely on difference between velocities of movement of molecules due to various sizes, charges or combination of those. After sufficient time has passed, clearly visible bands of separated molecules are observed using various possible detection schemes.
Think about two fishes moving down the stream. If they look identical and weigh the same, how do we know if any of them have eaten another small fish for dinner? And that is very important question, believe me! The only way to answer it is to take your stopwatch and wait for both fishes to swim down the stream far enough so that the difference in velocities becomes apparent depending on time sensitivity of your stopwatch.

If two of the molecules separated are
fluorescently labeled with different dyes they can be images by fluorescent
microscopy. This is shown in the example below where model receptor/toxin system has been separated
by Capillary Electrophoresis.Green-labeled GM1 is forming a complex with red-labeled CTB and moves slower than excess of unbound GM1. Clear green band of GM1 is followed by orange band of the complexed receptor/toxinmixture confirming the presence of toxin in the system.
This is a main principle of using separation assays for detection purposes of various viruses, toxins, etc. The problem with all these detection systems that they often must involve labeling of analytes and binding agents with dyes, and sometimes it may take long time to see clearly separated bands to be certain that the analyte is present. Two different flow velocities as shown in example with fishes are either obvious from visual analysis of images (observing clear separate bands) or can be determined by manual calculations from images as a function of time of separation, which is tedious, time-consuming and quite subjective process dependent on the analyst doing the calculations.
This is where patent ”Method for multivariate analysis of confocal temporal image sequences for velocity estimation” comes handy. It allows identifying whether there are two flow velocities present in images acquired as a function of time of separation from the way intensities of images themselves change with time.
- First very important benefit of this methodology that this can be done at the very beginning of experiment when no clearly visible separation is present with as few as first four acquired images.
- And the second benefit is that no labeling of molecular species is necessary as presence of two flow velocities can be determined from gray scale intensity of image at either Green orRed or overall RGB image converted to grayscale.