RESULTS
Burrowing Owls have been recorded on 56 of the 83 total BBS routes in NM (Fig. 1). Of the 56 routes, 25 routes show increasing trends, 16 routes show decreasing trends, 3 routes show no trend, and 12 routes do not have enough observations to calculate a trend (Fig. 2). After mapping trends, there is no apparent pattern in increasing or decreasing trends regionally in NM or by bird conservation region or physiographic stratum (Fig. 2,3,4).
BBS analyses show significant trends on six routes; four routes show a significant decrease in owls and two routes show a significant increase in owls (Fig. 5,6). Of interest, urban and agriculture uses comprised a greater proportion of area surrounding routes with decreasing trends than routes with increasing trends (Table 2, Fig. 7). The majority of land ownership around all routes was private. While Bureau of Land Management holds a greater proportion of land around increasing routes than around decreasing routes, Fish and Wildlife Service and State land holds a greater proportion of land around decreasing routes than around increasing routes (Table 3, Fig. 8). Vegetation types around routes with Burrowing Owls are expected from the habitat preferences of this grassland species, but the proportion of urban and farmland habitat is greater in declining areas (Table 4, Fig. 9). In addition, higher June temperatures and lower annual precipitation were found in areas with decreasing owl numbers (Table 5, Fig. 10,11,12).
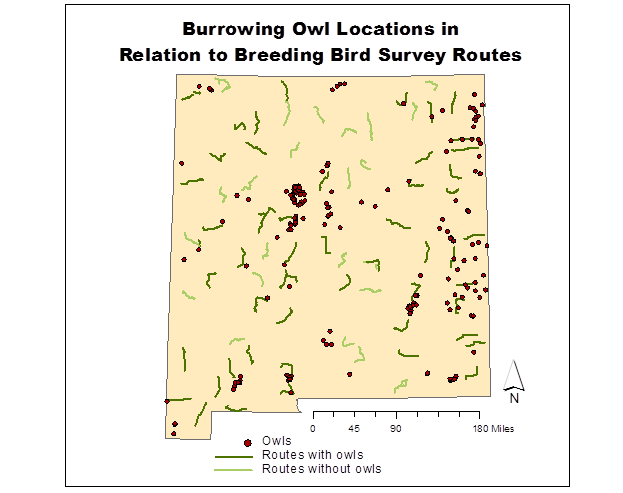
Fig. 1. Burrowing Owl locations reported to the New Mexico Burrowing Owl Working Group, with the distribution of owl locations relative to Breeding Bird Survey routes with and without owl records, New Mexico, USA.
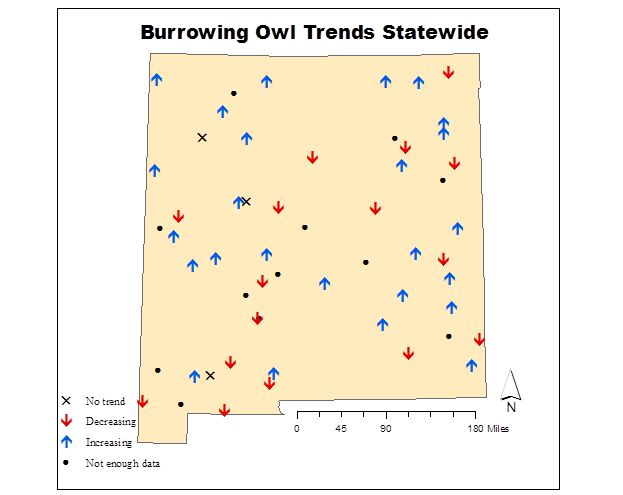
Fig. 2. Burrowing Owl trends recorded on Breeding Bird Survey routes, New Mexico, USA.
Table 2. Comparison of mean proportion of land use in Breeding Bird Survey route buffers with decreasing vs. increasing Burrowing Owl trends.
|
|
Decrease |
Increase |
|
Grassland |
52.2% |
47.4% |
|
Shrubland |
39.5% |
48.2% |
|
Forest |
3.5% |
1.9% |
|
Water |
1.2% |
1.1% |
|
Urban |
0.3% |
0.0% |
|
Agriculture |
3.0% |
1.3% |
|
Barren |
0.4% |
0.0% |
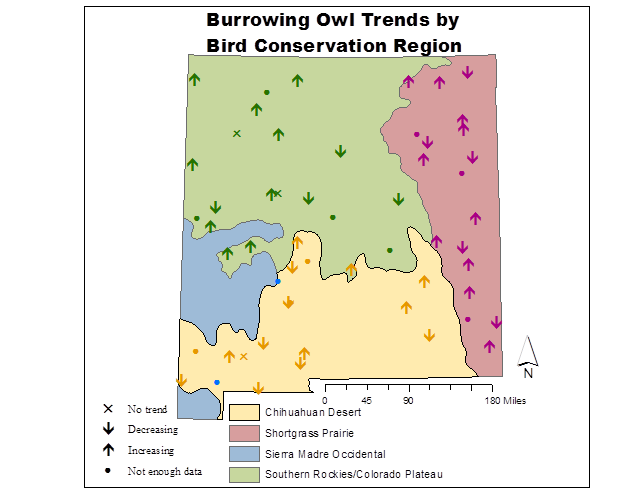
Fig. 3. Burrowing Owl trends by Bird Conservation Region, New Mexico, USA.
Table 3. Comparison of mean proportion of land ownership in Breeding Bird Survey route buffers with decreasing vs. increasing Burrowing Owl trends.
|
|
Decrease |
Increase |
|
Bureau of Land Management |
9.2% |
18.3% |
|
Bureau of Reclamation |
0.0% |
0.8% |
|
Fish and Wildlife Service |
8.5% |
2.0% |
|
Tribal |
0.2% |
0.0% |
|
Private |
67.5% |
69.8% |
|
State |
14.6% |
9.1% |
|
State Park |
0.1% |
0.0% |
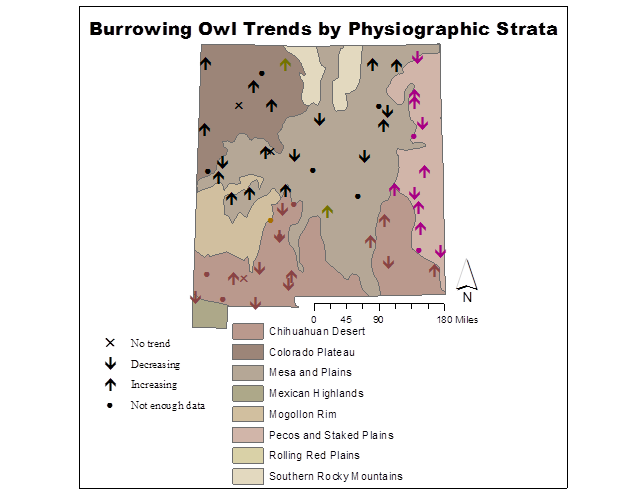
Fig. 4. Burrowing Owl trends by Physiographic Strata, New Mexico, USA.
Table 4. Comparison of mean proportion of vegetation in Breeding Bird Survey route buffers with decreasing vs. increasing Burrowing Owl trends.
|
|
Decrease |
Increase |
|
Plains-Mesa Grassland |
26.7% |
74.6% |
|
Desert Grassland |
24.9% |
19.7% |
|
Juniper Savanna |
14.9% |
0.0% |
|
Chihuahuan
Desert Scrub |
12.1% |
0.0% |
|
Plains-Mesa Sand Scrub |
3.6% |
0.0% |
|
Coniferous and Mixed Woodland |
6.0% |
5.7% |
|
Montane Coniferous Forest |
0.9% |
0.0% |
|
Urban, Farmland or Open Water |
10.7% |
0.0% |
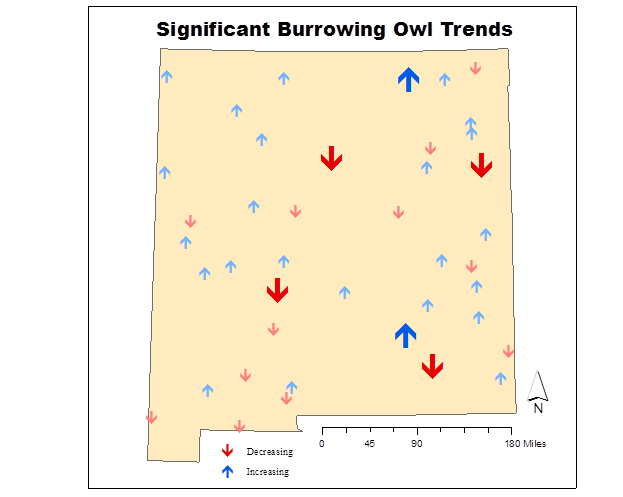
Fig. 5. Significant trends recorded on Breeding Bird Survey routes, New Mexico, USA.
Table 5. Comparison of 30-year mean temperature and precipitation in Breeding Bird Survey route buffers with decreasing vs. increasing Burrowing Owl trends.
|
|
Decrease |
Increase |
|
Mean June Temperature (OC) |
23.3 |
21.8 |
|
Max June Temperature (OC) |
32.6 |
30.9 |
|
Annual Precipitation (mm) |
343.7 |
372.8 |
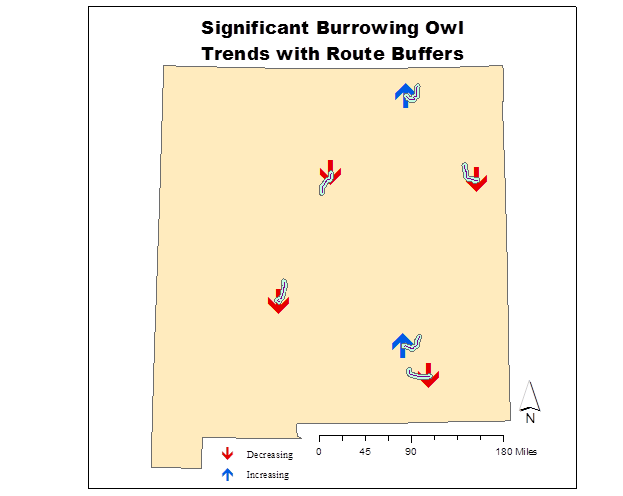
Fig. 6. Significant trends with eight kilometer buffer polygons, New Mexico, USA.
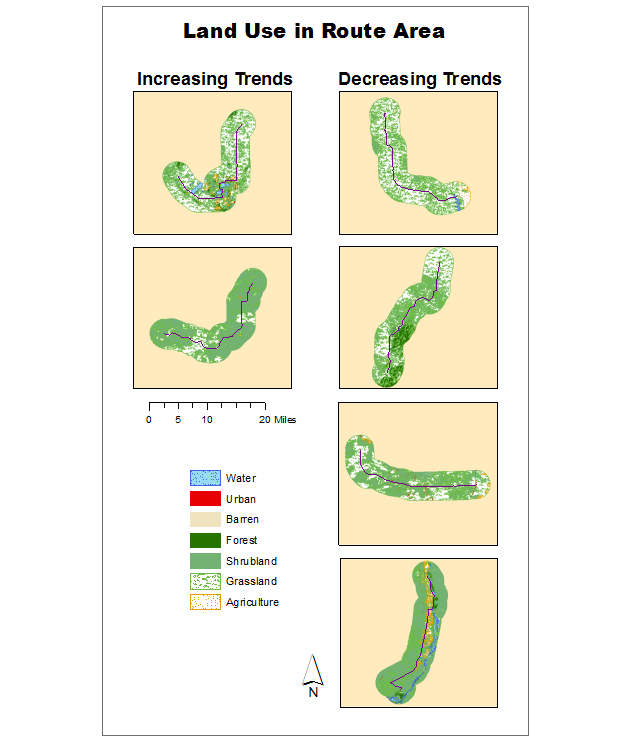
Fig. 7. Comparison of land use between areas with significant increasing or decreasing Burrowing Owl trends, New Mexico, USA.
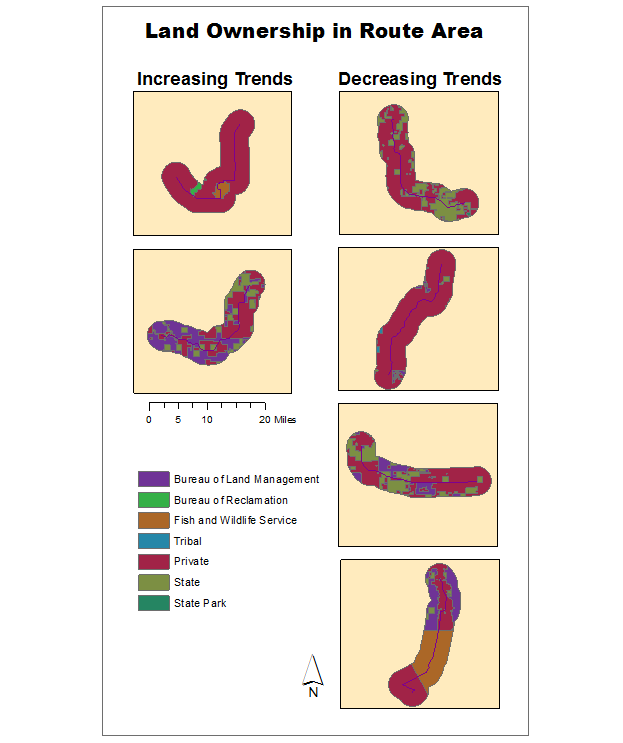
Fig. 8. Comparison of land ownership between areas with significant increasing or decreasing Burrowing Owl trends, New Mexico, USA.
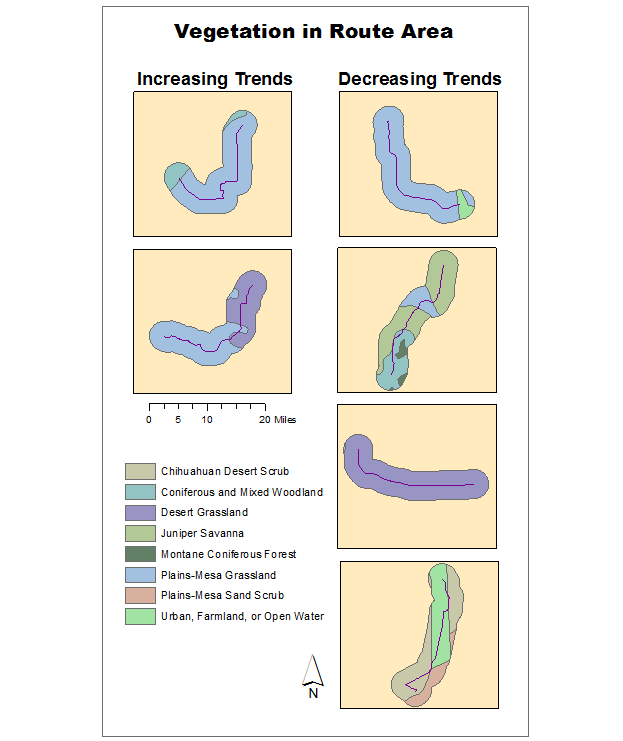
Fig. 9. Comparison of vegetation between areas with significant increasing or decreasing Burrowing Owl trends, New Mexico, USA.
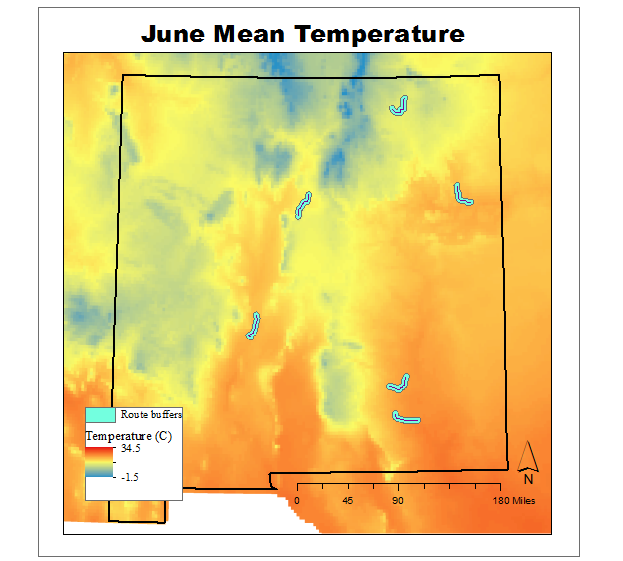
Fig. 10. June mean temperature 30-year normal 1981-2010, New Mexico, USA.
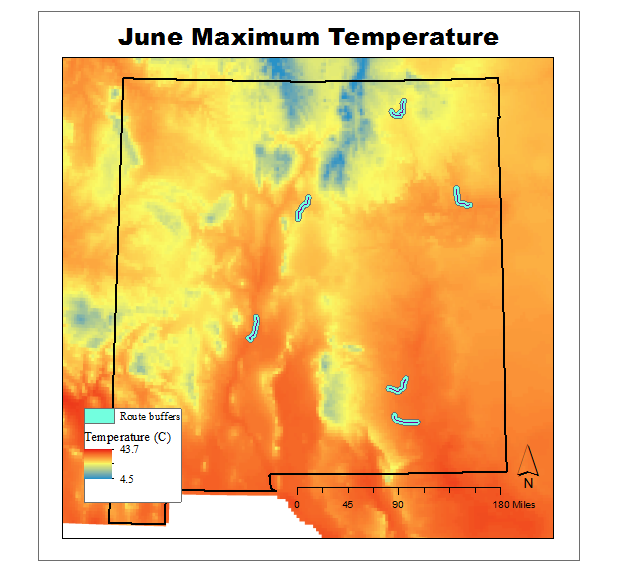
Fig. 11. June maximum temperature 30-year normal 1981-2010, New Mexico, USA.
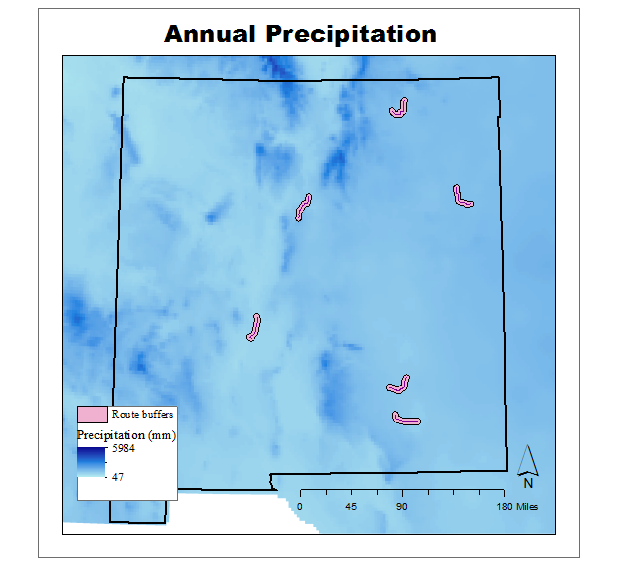
Fig. 12. Annual precipitation 30-year normal 1981-2010, New Mexico, USA.