Final Project
Investigation of groundwater level changes within the bosque above
and below the Alameda Drinking Water Diversion Dam
This project aims towards
understanding how and if the diversion dam, installed in 2005, has had an
effect on the levels of groundwater within the bosque surrounding the dam. My prediction was the groundwater levels would
increase above the dam because water pools behind the dam, and downstream
groundwater levels would decline. Data
used for this project was obtained from the Bosque Ecosystem Monitoring Program
(BEMP). www.bosqueschool.org/bemp./aspx
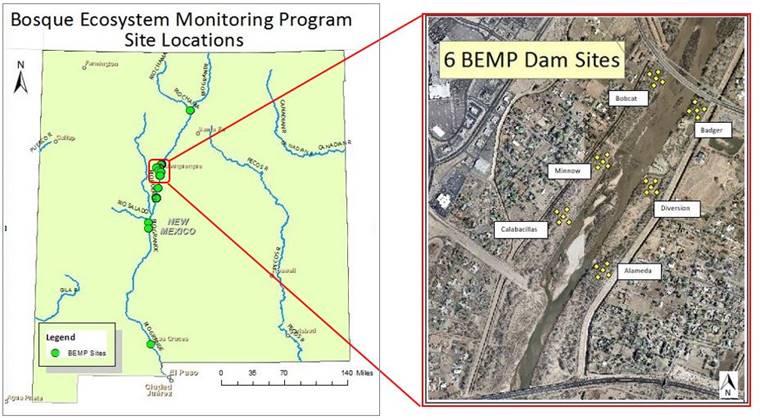
The
Bosque Ecosystem Monitoring Program has 29 monitoring sites the bosque
throughout New Mexico, primarily in the Middle Rio Grande. The organization collects variety of biotic
and abiotic data in order to understand how the bosque is changing over
time. The data is used by a variety of federal,
state, city, and local agencies to assist in management decisions. Six of the BEMP sites were used for this
project, they were Bobcat, Badger, Minnow, Diversion, Calabacillas, and
Alameda. Two of these sites, Bobcat and
Badger are above the diversion dam and the remaining sites are downstream from
the dam.
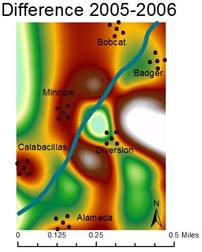
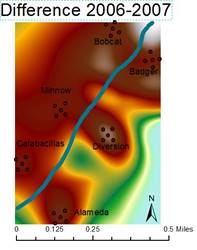
The
difference in mean annual depth to groundwater was calculated for all five
wells at each BEMP site and was entered into ArcMap 10.1 for analysis. The Interpolation tool from the Spatial
Analyst toolbox was used to create a series of images displaying the change in
depth to groundwater since the dam installation in 2005-2012. The Spline method of interpolation was used
per recommendation by Su Zhang, UNM GIS expert.
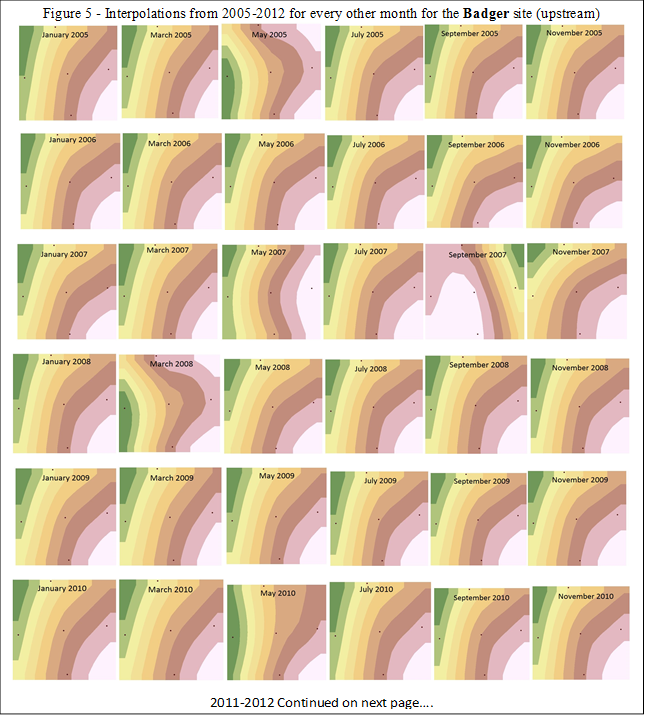
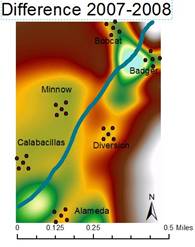
The series of interpolations can be seen below.
 *
*
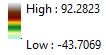
*negative values indicate an increase in groundwater
level
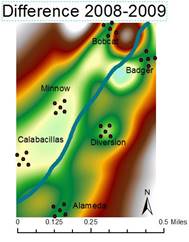
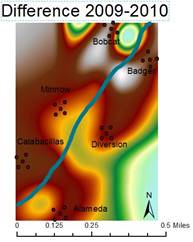
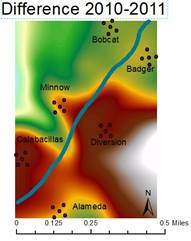
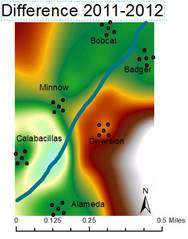
There
is a high degree of variability between each image, which makes it difficult to
determine any particular overall trend in groundwater level changes. In order to delve into the groundwater level
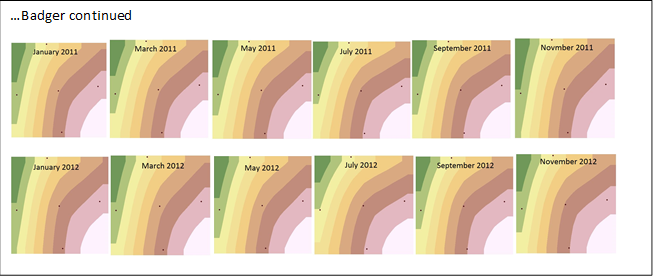
changes on a more detailed basis, one site above the dam (Badger), and one site
below the dam (Alameda) were chosen and interpolations were performed on their
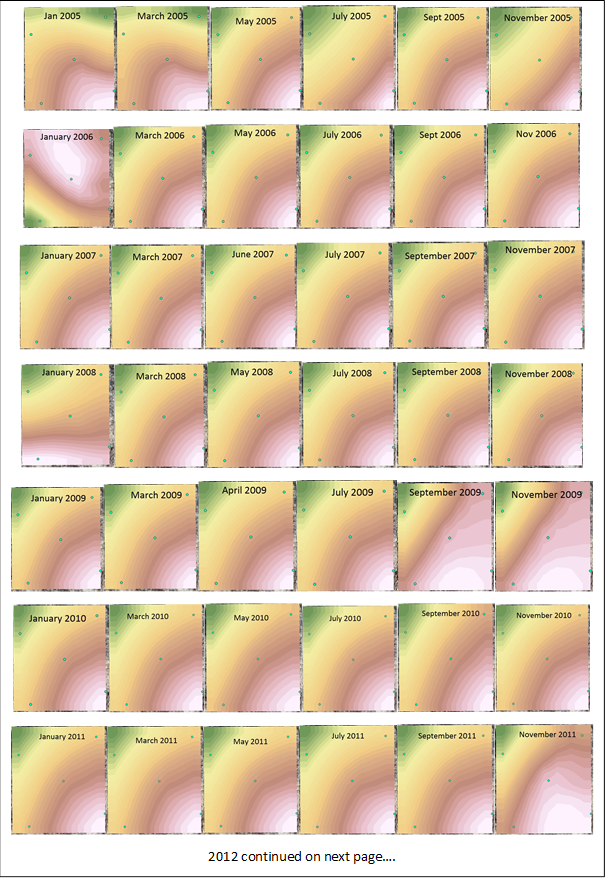
data every other month for the same period of record. The series of interpolations can be seen
below.
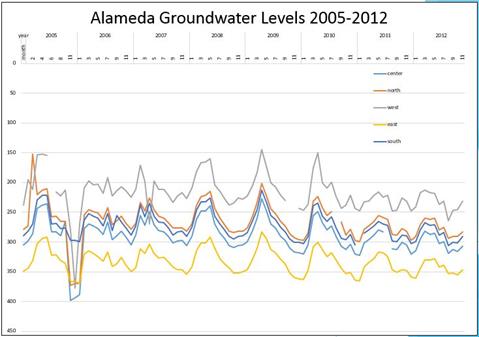
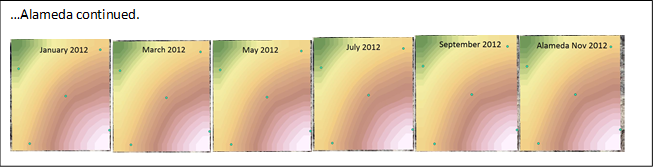
Alameda BEMP site Interpolations from 2005-2012
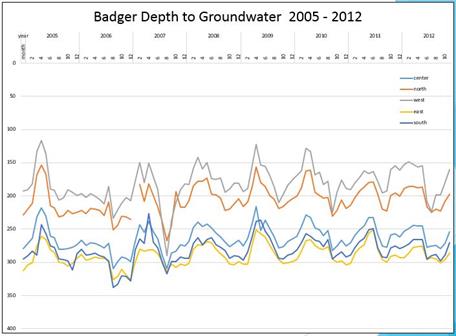
No significant trends can drawn
from the series of interpolations shown below.
Excel graphs showing the data reveal seasonal trends, however no overall
shift in groundwater can be determined throughout this period of record.