Miguel Santistevan
CE 547
Assignment #5
March 3, 2008
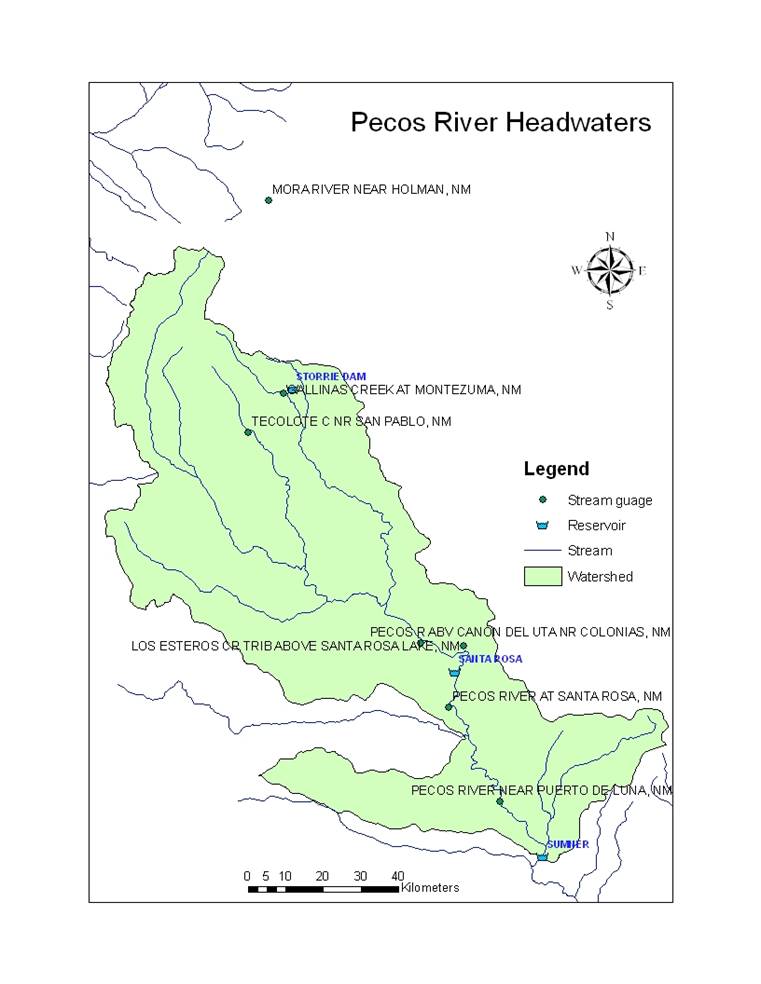
This assignment was an exercise in developing a map from online data sources. The above map was created from data that was available as a Hydrologic Unit coverage. Three interchange files were brought in, one with watershed boundaries, one with streams, and one with reservoirs. An area of the upper Pecos watershed was chosen as a focal point for this exercise. Stream gauge location data was then brought into the map as a layer but had to be converted to a shapefile and projected from NAD 83 geographic coordinates to an Albers projection. There were many more point of stream gauges available, but seven points were chosen to represent the utility of using online data for this kind of display or analysis.