Miguel Santistevan
CE 547
Assignment #6
Spatial Averaging
Soil Properties using Comppct
The ‘comp’ table was examined to discover properties of soils in New Mexico, organized by MapUnit. MapUnit NM963 has 5 different components as described in the table below:
|
Map Unit |
Name |
Percent composition |
Predominant surface
slope |
Dominant soil
texture |
Hydrologic soil
group |
|
NM963 1 |
Regnier |
27 |
15 |
Clay Loam |
D |
|
NM963 2 |
Latom |
27 |
15 |
Fine Sand Loam |
D |
|
NM963 3 |
Rock Outcrop |
18 |
99 |
UWB |
D |
|
NM963 4 |
Los Tanos |
12 |
5 |
Fine Sand Loam |
C |
|
NM963 5 |
Regnier |
7 |
35 |
Clay Loam |
D |
|
NM963 6 |
Latom |
5 |
40 |
Gravel-Fine Sand Loam |
D |
|
NM963 7 |
Regnier |
2 |
80 |
Gravel-Sand Clay Loam |
D |
|
NM 963 8 |
Gallen |
2 |
35 |
Gravel-Sand Loam |
B |
|
Hydro. Soil Grp |
Percent |
|
A |
0 |
|
B |
2 |
|
C |
12 |
|
D |
86 |
These soil properties make sense given that NM 963 is found at the lower end of this watershed and apparently in the floodplain, a location that would be a focal point of a large drainage area. It is predicted that clayey, poorly drained soils (D) would predominate in this area given constant weathering events that would bring this sediment down from the upper watershed and deposit it in the lower elevations of the drainage catchment.
Vertically
Integrating Soil Properties Over the Layers
The following table shows the number of soil layers, the depth of each soil layer, and the average depth for each component of map unit NM 963.
|
Map Unit component |
Number of soil
layers |
Depth of component (inches) |
Average Depth (inches) |
|
NM963 1 |
3 |
22 |
27/100*22 = 5.94 |
|
NM963 2 |
2 |
20 |
27/100*20 = 5.40 |
|
NM963 3 |
1 |
60 |
18/100*60 = 10.80 |
|
NM963 4 |
3 |
28 |
12/100*28 = 3.36 |
|
NM963 5 |
3 |
22 |
7/100*22 = 1.54 |
|
NM963 6 |
2 |
20 |
5/100*20 = 1.00 |
|
NM963 7 |
3 |
22 |
2/100*22 = 0.44 |
|
NM 963 8 |
4 |
60 |
2/100*60 = 1.20 |
The following table shows the total water holding capacity for each component.
|
Map Unit ID |
Seq. Num. |
Lower Depth |
Upper Depth |
Avail. Water Cap. (Low) |
Avail. Water Cap. (High) |
Ave. Avail Water Cap. |
Layer Depth |
Water Cap. |
Total Water Capacity |
Inches of Soil |
|
NM963 |
1 |
0 |
9 |
0.18 |
0.20 |
0.19 |
9 |
1.71 |
|
|
|
NM963 |
1 |
9 |
18 |
0.14 |
0.16 |
0.15 |
9 |
1.35 |
|
|
|
NM963 |
1 |
18 |
22 |
0.00 |
0.00 |
0 |
4 |
0 |
3.06 |
18 |
|
NM963 |
2 |
0 |
8 |
0.10 |
0.15 |
0.125 |
8 |
1 |
|
|
|
NM963 |
2 |
8 |
20 |
0.00 |
0.00 |
0 |
12 |
0 |
1 |
8 |
|
NM963 |
3 |
0 |
60 |
0.00 |
0.00 |
0 |
60 |
0 |
0 |
0 |
|
NM963 |
4 |
0 |
6 |
0.12 |
0.14 |
0.13 |
6 |
0.78 |
|
|
|
NM963 |
4 |
6 |
24 |
0.13 |
0.15 |
0.14 |
18 |
2.52 |
|
|
|
NM963 |
4 |
24 |
28 |
0.00 |
0.00 |
0 |
4 |
0 |
3.3 |
24 |
|
NM963 |
5 |
0 |
9 |
0.18 |
0.20 |
0.19 |
9 |
1.71 |
|
|
|
NM963 |
5 |
9 |
18 |
0.14 |
0.16 |
0.15 |
9 |
1.35 |
|
|
|
NM963 |
5 |
18 |
22 |
0.00 |
0.00 |
0 |
4 |
0 |
3.06 |
18 |
|
NM963 |
6 |
0 |
8 |
0.10 |
0.15 |
0.125 |
8 |
1 |
|
|
|
NM963 |
6 |
8 |
20 |
0.00 |
0.00 |
0 |
12 |
0 |
1 |
8 |
|
NM963 |
7 |
0 |
9 |
0.11 |
0.13 |
0.12 |
9 |
1.08 |
|
|
|
NM963 |
7 |
9 |
18 |
0.14 |
0.16 |
0.15 |
9 |
1.35 |
|
|
|
NM963 |
7 |
18 |
22 |
0.00 |
0.00 |
0 |
4 |
0 |
2.43 |
18 |
|
NM963 |
8 |
0 |
4 |
0.09 |
0.11 |
0.1 |
4 |
0.4 |
|
|
|
NM963 |
8 |
4 |
15 |
0.06 |
0.08 |
0.07 |
11 |
0.77 |
|
|
|
NM963 |
8 |
15 |
25 |
0.05 |
0.07 |
0.06 |
10 |
0.6 |
|
|
|
NM963 |
8 |
25 |
60 |
0.04 |
0.06 |
0.05 |
35 |
1.75 |
3.52 |
60 |
The average water holding capacity for soils across the map unit is 1.88 inches of water.
LAND USE
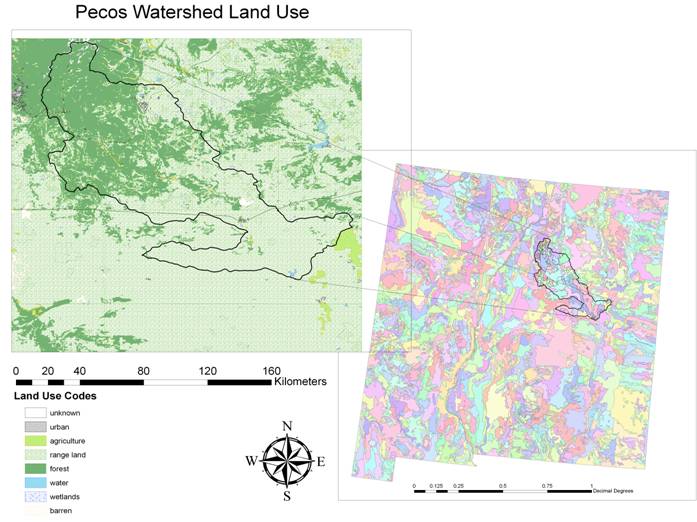
This layout show the land uses
for the Pecos watershed. The inset map
shows the diversity of soil types for the state of New Mexico and the location
of the Pecos Watershed.