RESULTS:
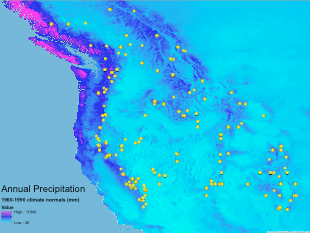
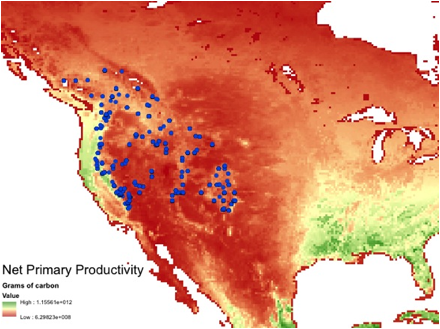
• Annual precipitation and plant
productivity = best effect
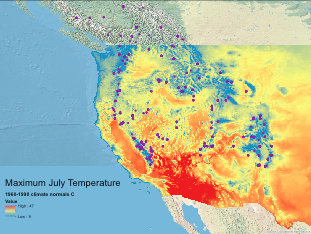
• Maximum July temps and elevation= some
effect
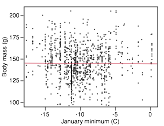
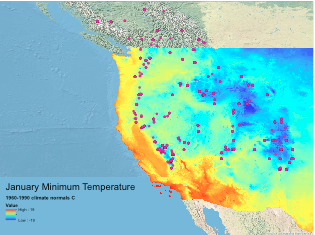
• Minimum January temps = no effect
• It appears that overall, pikas are responding to climate change by elevation
shifts, not body size evolution.


![]()
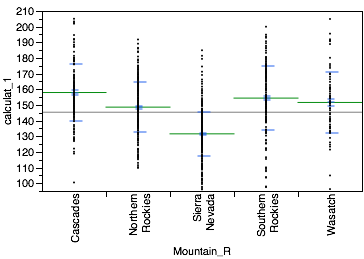
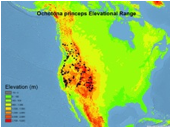
I found distinct
differences between several but not all of the pika
populations. The Cascade and Southern Rockies populations are similar to eachother and to Wasatch, but larger than all others. The
mean body mass of Northern Rockies overlapped with Wasatch and no one else. The
Sierra pika population is distinctly smaller than all
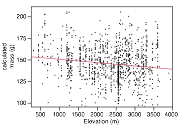
other populations. I found that the climate and environmental variables explained
little of the body size variation found in pikas. The
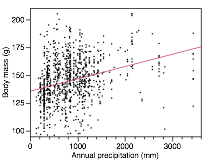
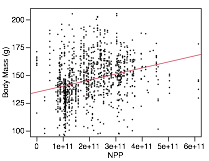
best predictors of pika body mass were precipitation
(R squared = 0.094, p < 0.0001) and net primary productivity (R squared =
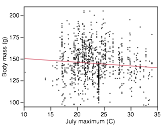
0.077, p < 0.0001). Elevation (R
squared = 0.022, p < 0.0001) and July maximum (R squared = 0.007, p <
0.0064) temperature explained some variation in body mass, and January minimum
temperature explained none (R squared = 5.364e-5, p = 0.81).