Pavel Vakhlamov
GIS HW5
Open a new map and save it.
In ArcCatalog navigate to the location of the map > right click and select data source > Set to same location as geodatabase file.
Add huc250k layer.

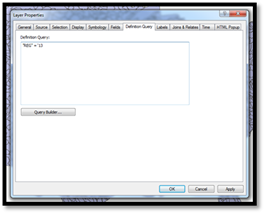
Select the Pecos subbasin by navigating to Properties > Definition Query and type in “REG” = ‘13’.

Select color scheme using unique values from category datafield “CAT’.


 Add
streams and reservoirs layers. Change symbology of
reservoirs to appropriate symbol.
Add
streams and reservoirs layers. Change symbology of
reservoirs to appropriate symbol.
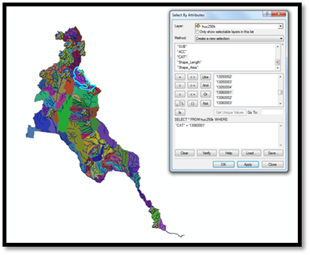
Using “select by attribute” select “CAT” = ‘13060001’ (from get unique values), verify and execute. This selects the Pecos subbasin.

Export selected features by right clicking huc250k layer > Data > Export data (using selected features). Add newly created layer.
Using “select by location” select streams and reservoirs (checkboxes) from source layer PecosSubbasin and “target layer features are completely within the source layer feature.
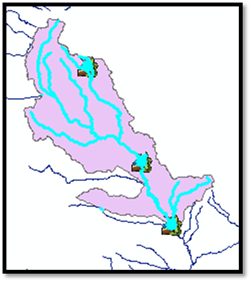
 This
does not work for the upper stream in the watershed because it is intersecting
the source layer boundary. Select by location yielded unsatisfactory results
for selecting all the streams within the subbasin.
This
does not work for the upper stream in the watershed because it is intersecting
the source layer boundary. Select by location yielded unsatisfactory results
for selecting all the streams within the subbasin.
“Target layer features have their centroid in the source layer feature” had the closest result, but selection included short segments of the streams intersecting the border of the subbasin of interest.
 Create
a layer that include the Pecos and the Pintada Arroyo
subbasins by Select by using “select by attribute”
select “CAT” = ‘13060001’ OR “CAT” = ‘13060002’. Verify and execute. Export
data by following the same steps that were used to export the PecosSubbasin layer.
Create
a layer that include the Pecos and the Pintada Arroyo
subbasins by Select by using “select by attribute”
select “CAT” = ‘13060001’ OR “CAT” = ‘13060002’. Verify and execute. Export
data by following the same steps that were used to export the PecosSubbasin layer.
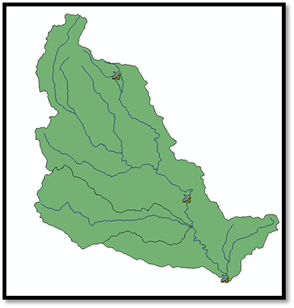
Using “select by lasso” select all the features of interest and export as a data layer for each (streams and reservoirs) layers.
Download required USGS datasets. Format the datasets by deleting all the extra information in excel. Save as excel spreadsheets.
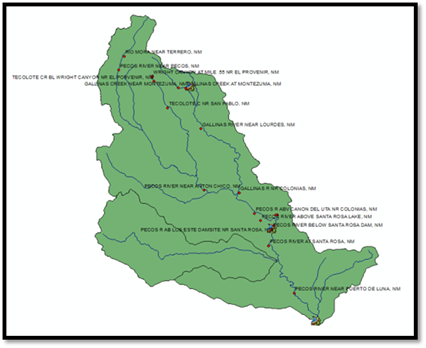
Add PecosHWSites file by “Add XY data”. Select the appropriate longitude, latitude and elevation fields and adjust the coordinate system to match your dataframe. Label the location names for all sites by going to added layers properties > Labels (label field “name”). Export the data layer (to be able to perform future query) as PecosHWGage.
Add the PecosHWData file as a table.
Joint the PecosHWGage attribute table to PecosHWData
by right clicking on PecosHWData layer > joins and
relates> join. Select unique common fields that appear in both datasets.
Verify and join. 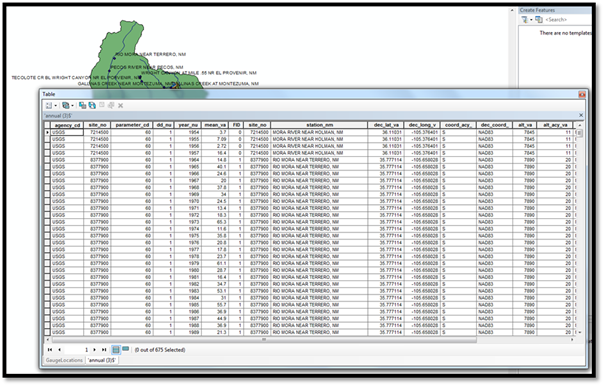
 Project
the locations from PecosHWData using “display XY data”
found in the table’s dropdown menu. The steps are the same as when PecosHWSites was projected (long and lat
fields, and appropriate coordinate system are selected). Export data as PecosHWDischarge and add to the map.
Project
the locations from PecosHWData using “display XY data”
found in the table’s dropdown menu. The steps are the same as when PecosHWSites was projected (long and lat
fields, and appropriate coordinate system are selected). Export data as PecosHWDischarge and add to the map.
In the properties of the newly created layer select “symbology” > graduated symbols and classify the discharge data in to 10 classes. In the same layer properties navigate to the “time” tab. Identify time-relevant table (in our case years), time step interval, click “calculate” to determine the time extent and identify time zone.
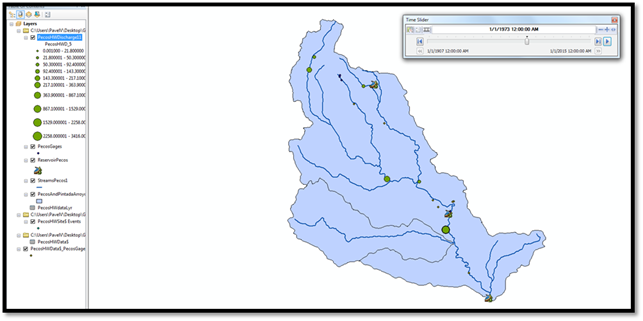
On the main navigation menu select “time slider” tool and press play to illustrate the time-lapse on the discharge data in the area of interest.