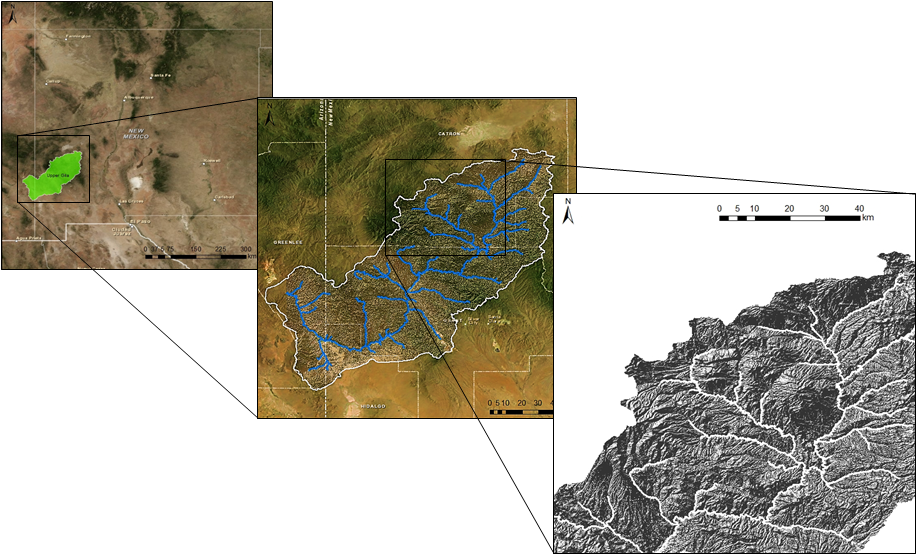
 Location of the upper Gila Watershed
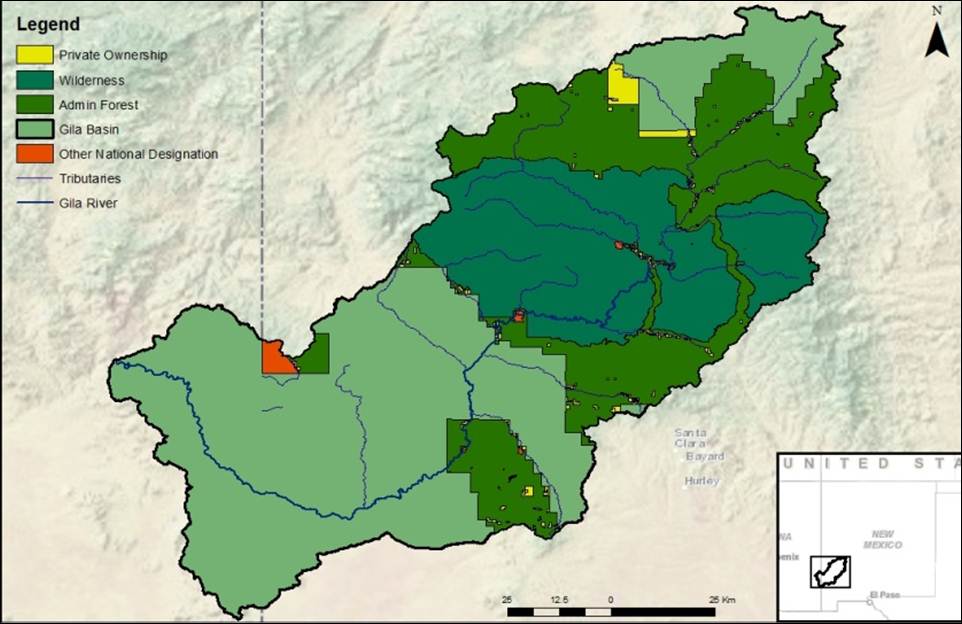
Land uses in
the Gila Watershed
Evaluating Solute
Sources and source distribution in the upper Gila River Basin
Abstract:
The upper Gila River is located in the southwestern
New Mexico, and categorized as one of the last free flowing streams in the
United States. It exhibits substantial spatial and temporal variability of solute
concentrations across the watershed. Significant trends of salinization are
evident by increase of concentrations of major ion, as well as many trace
elements, in downstream progression. Understanding the dynamics of chemical
variability of this system is vital for evaluation of the Gila River as a sustainable
source of water for the downstream communities.
Deriving its
headwaters in the Mogollon-Datil volcanic field, the upper Gila River has a
significant number of perennial springs. Volumetrically small such endogenic sources
of recharge could have a substantial impact on chemical composition of the
stream and lead to salinization of the system. Impairment of the water quality
in the Gila River is most evident during prolonged drought conditions when the
system discharge is reduced to base flow conditions.
Commonly accepted
climatologic projections suggest reduced amounts of annual precipitation and
increase in temperature, which signifies prolonged base flow conditions. During
low flow regimes springs have been determined to be the primary sources of
recharge in the upper Gila River.
Primary objectives
of this project are to evaluate spatial distribution of endogenic sources of
recharge and their impact on chemical composition of the stream. Concurrently
it is important to take in to consideration recent wildfires that have impacted
large areas of multiple sub-watersheds in the headwaters of major tributaries.
Ash flows as well as resulting erosional processes of impacted regions could
revile to be significant contributors of solutes and sources of impairment for
the stream.
Acknowledgment: I thank Dr. Laura Crossey and Dr. Abdul-Mehdi Ali for
contributing to data analysis and providing necessary instrumentation to
perform this study.
Outline:
I.
Purpose:
1. Create Gila River Profile using GIS
·
Plot
elevation and length of streams within the system
2. Compare sources of solutes and
confluence mixing
·
Evaluate
impact of springs on chemical composition of streams
·
Major
confluences
·
Downstream
progression
·
Variability
between sampling dates
3. Quantifying fire impacted areas
·
Estimate
percent of burnt area of the impacted sub-watersheds
II.
Regional setting:
1. Location and spatial parameters
2. Land use
3. Hydrology
4. Climate
III.
Methods:
1. Data collection:
2. Laboratory analysis
3. Geographic Information Systems
Analysis
4. Displaying acquired data
IV.
Results
Introduction
For
well over a century, agriculture, ranching, mining, flood control, and
municipal development have placed an increasing demand on the scarce water
resources of the southwestern United States. Today, both surface and
groundwater remain major water sources for numerous urban, ranching, and
agricultural communities along the Gila drainage basin. Water quality is of
great concern due to the general scarcity of renewable water supplies in the
region (Phillips et al., 2003; Mills,
2003; Plummer et al., 2004; Newell et al., 2005; Anning
et al., 2007).
In
order to understand the complex interactions and impact of the
water-quality-impairing sources on the Upper Gila subbasin, it is essential to
approach the problem with consideration of surface and groundwater as an
integrated system (Winter et al., 1998).
Although the Gila River is the
dominant surface water feature in the region, numerous springs, many of
endogenic origin, may have significant impact on the hydrochemical
composition of the stream. Many of these springs emerge along faults and
fractures of the underlying volcanic bedrock predominant to the regional
geology of the Mogolon-Datil volcanic field. Although
volumetrically small in comparison to the dominant surface stream, recent
research suggests such springs are geochemically important deep fluid
transports of many components, including elements derived from interaction with
the Earth’s upper mantle (Newell et al., 2005; Crossey
et al., 2006; Crossey et al., 2009). Previous studies
suggest that deep-seated faults in the bedrock create a complex of conduits
which allows deeply derived fluids to ascend to the surface. However,
understanding the hydraulic properties of fault fluid transport remains vague,
largely due to the technological constrains which limit the acquisition of
detailed property distribution from within active faults (Newell
et al., 2005; Crossey et al., 2006; Crossey et al., 2009, Fairley, 2009).
Fault fluid transport modeling largely demonstrates conductive capacity orders
of magnitude higher along the fault plane than surrounding matrix (Summers,
1982, Fetter, 1994; Lallahem et al., 2007).
In the deeper flows, through fractured bedrock, longer term geochemical
interactions determine the chemistry of waters that eventually discharge to the
stream. Conversely, during snowmelt and storm events, faults may transmit
significant amounts of flow through the subsurface resulting in the hillside
springs with chemical alteration interrelated with landscape cover features
(geology, soil, and vegetation types) (Winter et al., 1998;
Acuña and Dahm, 2006).
During periods of low rainfall, streams in mountainous terrains are reduced to
base flow and exist due to drainage from saturated alluvium in the valley
bottoms and perennial springs from bedrock fractures. Mixing of these
chemically different waters results in geochemical reactions that affect the
chemistry of the water in the stream (Winter et al.,
1998). Quantifying discharge of a given spring presents a challenge
due to the inability to measure volumes contributed by numerous discharge
points along a given fault system and conducted through surface flows as well
as shallow alluvium of the inner valley fill.
Purpose
In order to better understand
longitudinal distribution of the sources of solutes distribution in the Gila
River and its many tributaries a detailed river profile had to be constructed.
Projecting
chemical analysis data of major ions for better understanding and interpretation
of complex mixing processes of contributing surface and endogenic sources of
solutes to the upper Gila River system.
Quantifying
areas of sub-watersheds impacted by wildfires.
Regional Setting
Location and spatial parameters
The
Gila River watershed is located on the New Mexico-Arizona border in the Datil-Mogollon
section of the Transition-Zone province (Hawley 1969,
1975, 1986: Morrison 1991). Drainage basin portion located in
New Mexico has an area of approximately 9,300km2 (3,590mi2).
The upper Gila River subbasin derives its headwaters in the Mogollon – Datil volcanic
field and has an area of 7,780 km2 (2,645 mi2). The
Continental Divide defines northern, eastern, and southern watershed
boundaries, while the northwestern boundary is confined by the San Francisco
watershed. High plateaus of the Mogollon-Datil volcanic field overlook deeply
carved canyons which are predominant geomorphic features of the entire
Upper-Gila watershed. Elevation of the Mogollon-Datil section ranges from
3,320m (10,892ft) at Whitewater Baldy in the Mogollon Mountains to 1,463m
(4,800 ft.) at Redrock in the Gila River Valley.
Land Uses
Landcover of the Upper Gila subbasin is
comprised primarily of extensive forested areas of high elevations and
rangeland in most of the rest of the basin. An urban and agricultural development
is only found in one location along the river valley, located near the
Gila-Cliff subbasin boundary. No major consumptive water use has been recorded
in the Upper Gila subbasin (Hawley et al., 2000).
Hydrology
The
surficial layer of Upper Quaternary valley fill associated with the Upper Gila
River, comprises a shallow aquifer unit, with saturated thicknesses of up to 30
m (100 ft). Even though this hydrogeologic
unit is areally limited by the narrow canyon walls,
it is recognized to be of key importance to the recharge of perennial and
intermittent tributaries.
Climate
The
Gila River system falls in to a category of arid to subhumid
climatic regions with an annual precipitation ranging from 23.1cm (9.1 in) at
the Virden Station to 51 cm (20 in) at the Pinos
Altos station located on the continental Divide (elev. 2,134 m; 7,000 ft). The average spatial variability in temperature ranges
from 15.1oC at Redrock (elev. 1,483 m; 4,900 ft) to
11.6oC at Gila Hot Springs (elev. 1,707m; 5,600ft). The monsoonal
regimes, which occur from July through September and contribute nearly half of
the annual precipitation in the region (NCDC, 1999,
Hawley et al., 2000). However, historical records from 1929
and 1973 report 35% (51 cm (20 in)) of the annual precipitation had been
contributed by winter precipitation (Gabin and
Lesperance 1977). Such significant amounts of winter
precipitations are attributed to quasiperiodic climate patterns, and are driven
by the southern oscillation cycles. Controversially, observations from winter
2010-2011 report substantial dry conditions throughout Gila watershed
exhibiting a sharp contrast from winters in the previous several years. A
number of climatologic models project considerable increase of average annual
temperatures and significant decrease in annual precipitation. Dryer and hotter
conditions suggest an increase in frequency and persistency of base flow
conditions. In response to low flow conditions, stream water quality will
degrade due to salt loading contributed by perennial springs.
Data Collection
Campaign sampling
Samples
were collected precisely following the EPA protocol. Each of the sampling
locations were evaluated in upstream to downstream progression. To evaluate an
impact of a given tributary on the chemical composition of the stream, field
parameters and samples were collected approximately 100 meters above and below
each confluence with perennial tributary as well as endogenic contributing
sources. Sampling locations were field-referenced using Garmin 60c portable GPS
device. Readings of temperature, pH, conductivity, specific conductance, and
dissolved oxygen (percent saturation and mg/L) field parameters were taken and
recorded in triplicates, to minimize potential errors, using an Oakton pH/CON
300 Series and Oakton DO6 series field instruments. Field measurements from
each stream location were taken midstream in approximately two inches below the
water surface. Springs were sampled at the closest possible proximity to the orifice.
Sample collection and preservation
Concurrently
to collection of field parameters, two volumetric aliquots were collected into
125ml bottles, pre-conditioned by triple-rinse with sampling water.
Preservation method varies by the objective of future analysis. Aliquot
intended for alkalinity and anion analysis is sealed in a sterile storage
bottle, eliminating atmospheric void, referred to as headspace, from the
container to minimize degassing. A second volume of the sample was passed
through a 0.45μm filter, fixed with small amount of concentrated nitric
acid and stored in a sterile, triple-rinsed with filtered sample, container for
future cation analysis. All collected samples must be
refrigerated to 4 °C as soon as possible after collection and remain cooled
until the analysis.
Geochemical data analysis
Once
chemical compositions of the waters were obtained, complex analytical software
(PHREEQC) was
utilized to accurately model mixing conditions and end members of these processes.
PHREEQC was developed by the USGS (Parkhurst and Appelo, 1999) to perform low-temperature aqueous
geochemical calculations. The code was used to evaluate the state of saturation
with respect to mineral phases as well as to compute equilibrium pCO2 based on
pH, alkalinity, and ionic strength. It was also used to speciate all water
sampled and calculate saturation indices of calcite, gypsum, dolomite, halite,
and carbonate species, as well as perform binary mixing modeling and inverse modeling
to identify potential end member chemistries.
Geographic
information systems analysis
In
order to better understand longitudinal distribution of endogenic sources of
recharge and their spatial relationship to fault conduits, a river profile was
produced. The following steps describe step by step process used to create
streams, delineate the Upper Gila watershed, and analyze features’ attributes
and extract of necessary data.
Defining streams and
watersheds
a.
Add DEM of the desired area. Using symbology assign appropriate colors and check hillshade box (Right-click on DEM layer > properties
> symbology > color ramp).
b.
Projection.
Make sure DEM and data frame in the same projection (Data management >
projections and transformations > raster > project raster).
c.
Fill
(special analyst > hydrology > fill) and save output as raster.
d.
Flow direction. Using spatial analyst and based and fill raster calculate flow direction
(spatial analyst > hydrology > flow direction).
e.
Flow accumulation. Using spatial analyst calculate flow accumulation (spatial
analyst > hydrology > flow accumulation).
f.
Stream link. Using spatial analyst define streams by minimum cell
confluence in to single cell.
g. Stream to feature. River shapefile
was created using stream to feature tool found in spatial analyst toolbox.
h. Delineating watershed. Delineation of the watershed was
performed using spatial analyst watershed tool.
River Profile:
a. Flow length. Using flow direction calculate flow
length (spatial analyst > hydrology > flow length).
b. Assigning headwater points. Add new “point” shapefile
(Arc catalog > right click (desired folder) > new > shapefile (feature type = point, select correct
projection). Using editor tool assign
headwaters of each stream (right-click on newly created shapefile
> edit feature > start editing). Create point for the beginning of each desired
stream. In editor tool select ‘stop editing’ and save edits.
c. Cost path. Using
spatial analyst tool determine the distance (spatial analyst > distance >
cost path). Input raster = headwaters shapefile, Cost
distance = flow accumulation raster, backlink raster = flow direction raster,
output raster = user defined. (Calculates
the least-cost path from a source to a destination).
d. Extracting data. Using the sample tool extract x, y,
z, length and accumulation data in to a .dbf file (spatial analyst > extraction
> sample). Select layers: filled DEM, flow length, flow accumulation. Input
location raster or point feature = costpath raster.
Resampling technique = ‘BILINEAR’.
e. Defining main stream. Set the identify tool to read the
flow length raster and identify the headwater with greatest value. Repeat the
steps described above for the identified point to extract the values.
f.
Final data visualization was
created as a graph using Excel based on the data extracted from GIS. Springs
and faults were extracted and plotted using same methods as described above.
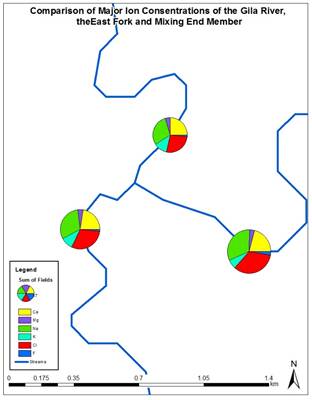
Displaying Major Ion
Concentrations
a.
Data management. Using Excel, data acquired from chemical analysis was formatted for
further GIS analysis.
b.
Importing data. Acquired chemistry data was imported
in to GIS as a data table and projected using corresponding longitude and
latitude coordinates.
c.
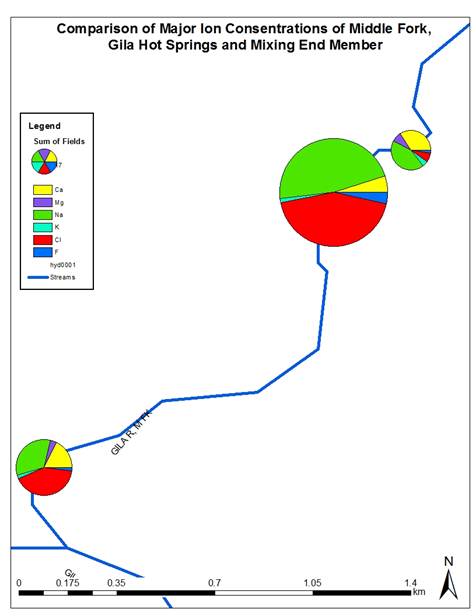
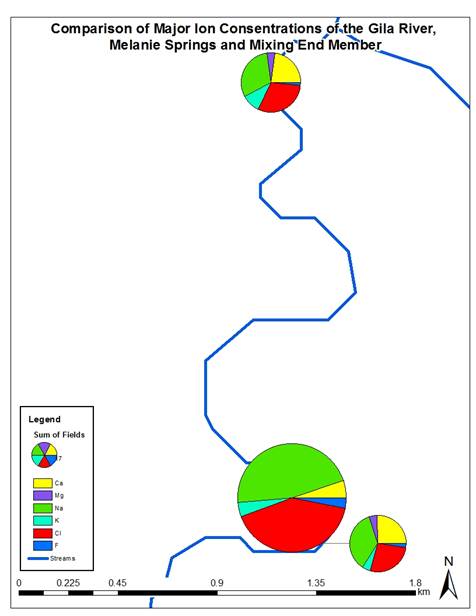
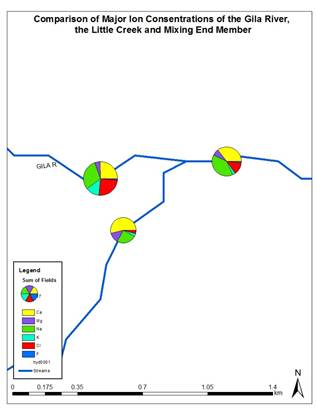
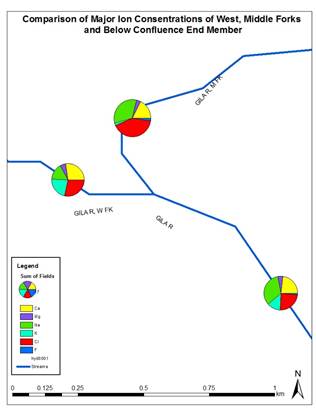
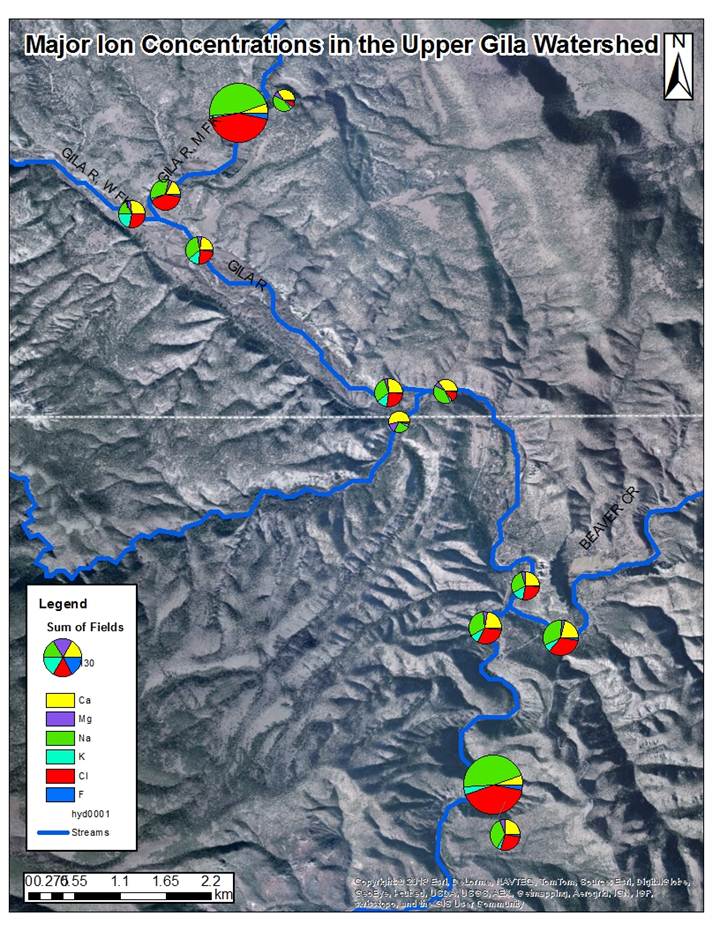
Displaying data In order to adequately compare and
interpret the results, concentrations of major ion was displayed as a pie chart
and rendered proportionate to the sum of the major ions. All the major
confluences and significant sources of solutes were exported as separate maps
for enhanced visual comparison.
Fire Impact
a.
Add
fire impact layer.
b. Clip. Clip the layer to the Upper
Gila Watershed layer.
c. Add subbasin layer. Using select by
polygon create separate layers for each impacted sub-basin.
d. Clip fire impact layer to created
individual sub-basins.
e. Using spatial statistics tool
calculate area of each impacted region.
Conclusions
Elevation
profile illustrated that majority of the springs are located in the upper
reaches of the upper Gila watershed. Contrary to previous assumptions endogenic
sources of solutes do not correlate with near proximity to the major fault
lines.
Projections
of the chemical analysis indicate that spring have a significant impact on
major ion concentrations. Furthermore the springs located several kilometers
apart have a nearly identical chemical composition.
Changes
in hydrochemical compositions below evaluated
confluences could possibly be used to quantify volumetric relationships of
individual strams.
The
fire impacted regions cover significant area. Subbasin 1 = 316km2,
Subbasin 2 = 173km2, Subbasin 3 = 238km2.
Future work
Further
analysis of correlations between fire impacted areas will be performed once
continuous monitoring data from deployed dataloggers
will be uploaded.
Data
obtained by hydrochemical modeling will be projected
using GIS and compared to actual values produced by chemical analysis of the
samples.
References
Acuña V.¸ Dahm C. N., 2007. Impact of monsoonal rains on spatial
scaling patterns in water
chemistry of a
semiarid river network.Journal
of Geophysical Research, Vol. 112.The
American Geophysical Union.
Anning,
D.W., Bauch, N.J., Garner, S.J., Flynn, M.E., Hamlin,
S.N., Moore, S.J.,Schaefer, D.H., Anderholm,
S.K., Spangler, L.E., 2007. “Dissolved solids in basin-fillaquifers
and streams in the southwestern United States.” United States GeologicalSurvey Scientific Investigations Report 2006-515.
Bartolino,
J.R., and J.C. Cole, 2002. "Ground-water resources of the middle Rio
Grande
basin,
New Mexico." United States Geological Survey Circular 1222.
Bauer,
P.W., P.S. Johnson, and S. Timmons, 2007. “Springs of the Rio Grande gorge,
Taos
County, New Mexico: Inventory, data report, and preliminary geochemistry.”
New Mexico
Bureau of Geology and Mineral Resources Final Technical Report.
Open-File
Report 506.
Crossey,
L.J., Fischer, T.P., Patchett, P.J., Karlstrom, K.E., Hilton, D.R., Newell, D.L.,
Huntoon,
P., 2006. “Dissected hydrologic system at the Grand Canyon: Interaction
between
deeply derived fluids and plateau aquifer waters in modern springs and
travertine.”
Geology 34.1: 25-28.
Crossey,
L.J., Karlstrom, K.E., Springer, A., Newell, D.,
Hilton, D.R., Fischer, T., 2009.
“Degassing
of mantle-derived CO2 and 3He
from springs in the southern Colorado
Plateau
region - flux rates, neotectonics connections, and
implications for
understanding
the groundwater system.” Geological Society of America Bulletin in
press.
Chapin C. E., Dunbar N. W.,
1994.A Regional Perspective on Arsenic in Water of the Middle Rio Grande Basin,
New Mexico.The
Water Future of Albuquerque and Middle Rio Grande Basin. New
Mexico Water Resources Research Institute, New Mexico Bureau of Mines and
Mineral
Resources Campus Station
Socorro, NM.
Fairley
J., 2009. “Modeling fluid flow in a heterogeneous, fault-controlled
hydrothermal system” Geofluids9, 153–166University
of Idaho, Moscow, Idaho.
Hawley, J.W., Hibbs. J.B,
Kennedy J.F., Creel J. B., Remmenega M.D., Johnson
M., Lee M.M.,
Dinterman p., 2000.Trans-International Boundary
Aquifers in Southwestern New
Mexico.
Mills,
S.K., 2003. “Quantifying Salinization of the Rio Grande Using Environmental
Tracers.”M.S.
Thesis New Mexico Institute of Mining and Technology.
Newell,
D.L., Crossey, L.J., Karlstrom,
K.E., Fischer, T.P., 2005. “Continental-scale links
between
the mantle and groundwater systems of the western United States: Evidence from
travertine springs and regional He isotope data.” GSA Today 15.12: 4-10.
Newell,
D.L., 2007. “Hydrogeochemistry of CO2-rich
mineral springs: Implications for
tectonics
and microbiology”. Ph.D. Dissertation, University of New Mexico. 156p.
Phillips F. M., Mills S., Hendrickx M.H., Hogan J., 2003. Environmental Tracers
Applied to
Quantify Causes of Salinity
in Arid-Region Rivers: Results from the Rio Grande Basin,
Southwestern USA. Water
Resources Perspectives: Evaluation, Management and Policy, 327-
334.
Plummer,
L.N., Bexfield, L.M., Anderholm,
S.K., Sanford, W.E., Busenberg, E., 2004.
“Geochemical
characterization of ground-water flow in the Santa Fe Group aquifer
system,
Middle Rio Grande Basin, New Mexico.” United States Geological Survey
Water-Resources
Investigations Report 2003-4131.
Rawling,
G., Timmons, S., Newton, T. Walsh, P., Land, L., Kludt,
T., Timmons, M.,
Johnson,
P., Felix, B., 2008. “Sacramento Mountains Hydrogeology Study” New
Mexico
Bureau of Geology and Mineral Resources Open File Report 512.
Schwab G.
E., Summers W.K., Colpitts R.M., Teuten
C.E., Young W. K., 1982. “Pumping Tests of Well Campbell et al. No. 2 Gila Hot
Springs, Grant County, New Mexico.” U.S. Department of
Energy.
Winter,
T.C., Harvey, J.W., Franke, O.L., Alley, W.M., 1998.
“Ground water and surface
water:
A single resource.” United States Geological Survey Circular 1139.
Witcher J. C.,
Lund J. W., 2002. Gila Hot Springs. GHC Bulletin. Southwest
Technology DevelopmentInstitute NMSU, Las Cruces, NM, Geo-Heat Center.
Location of the upper Gila Watershed
Land uses in
the Gila Watershed
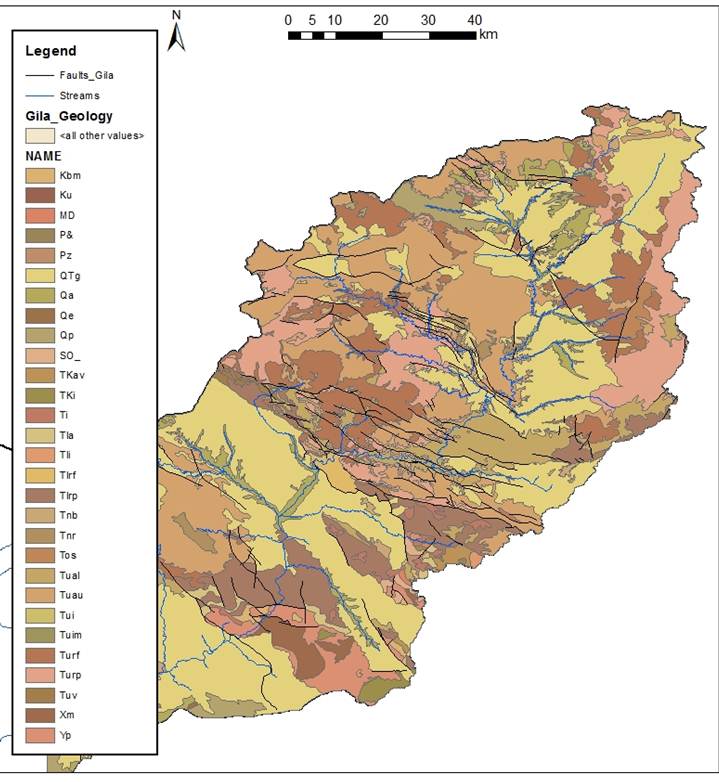
Geology o
the Gila Watershed
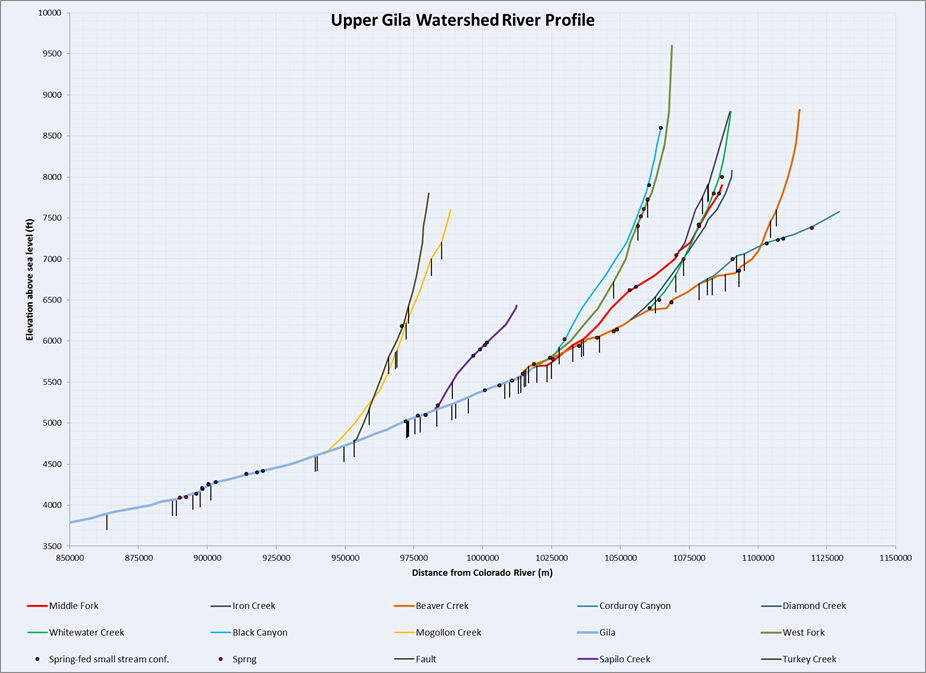
Elevation
Profile of the upper Gila River subbasin.

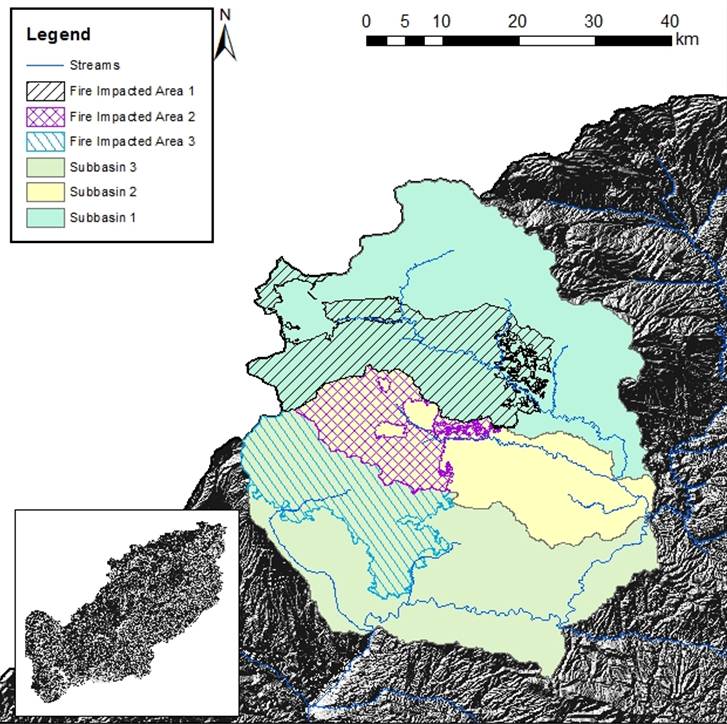
Areas
impacted by fire (2012)
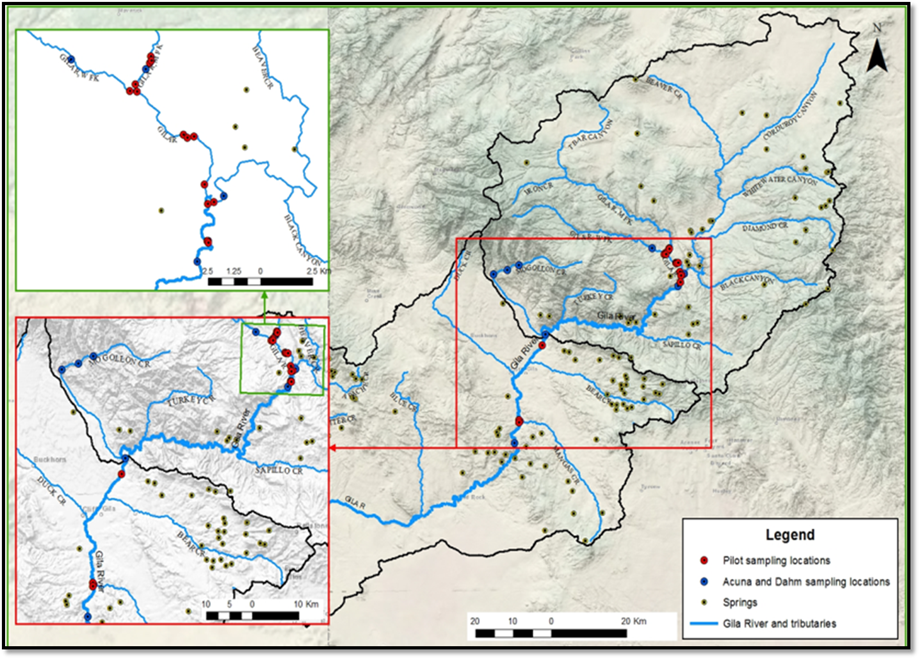
Sampling
locations.
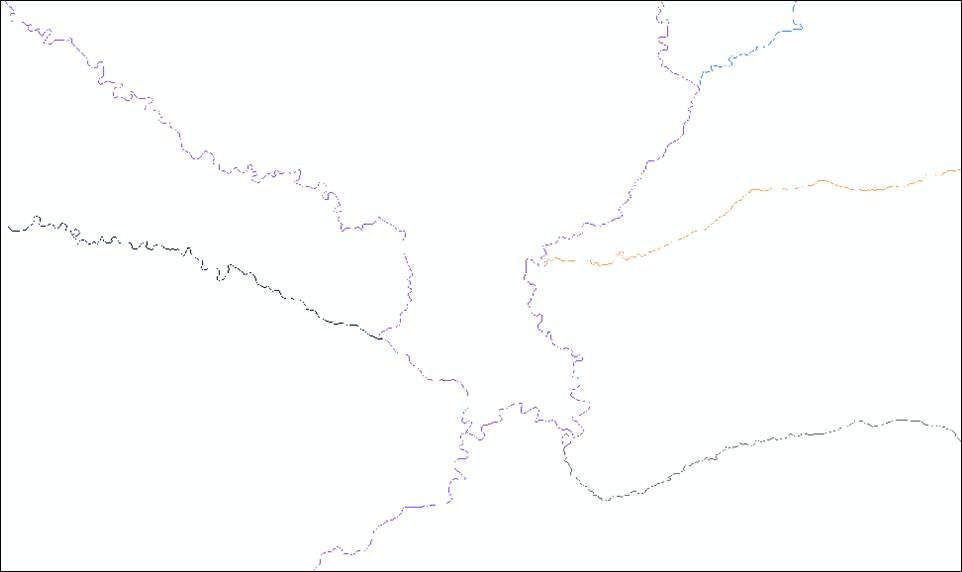
Cost path
calculation used for creation of the river profile.
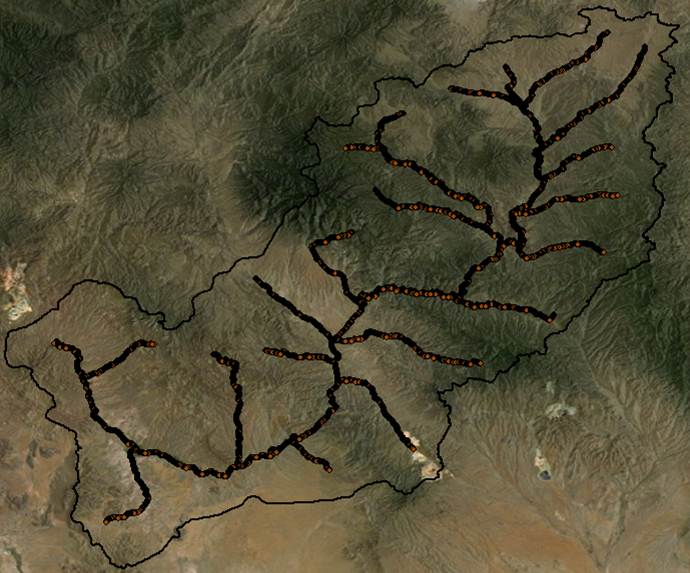
Points
created as the final results of river profile analyses.
Comparison
of the Gila Hot
Springs and the Melanie Hot Springs
ggg