Homework #4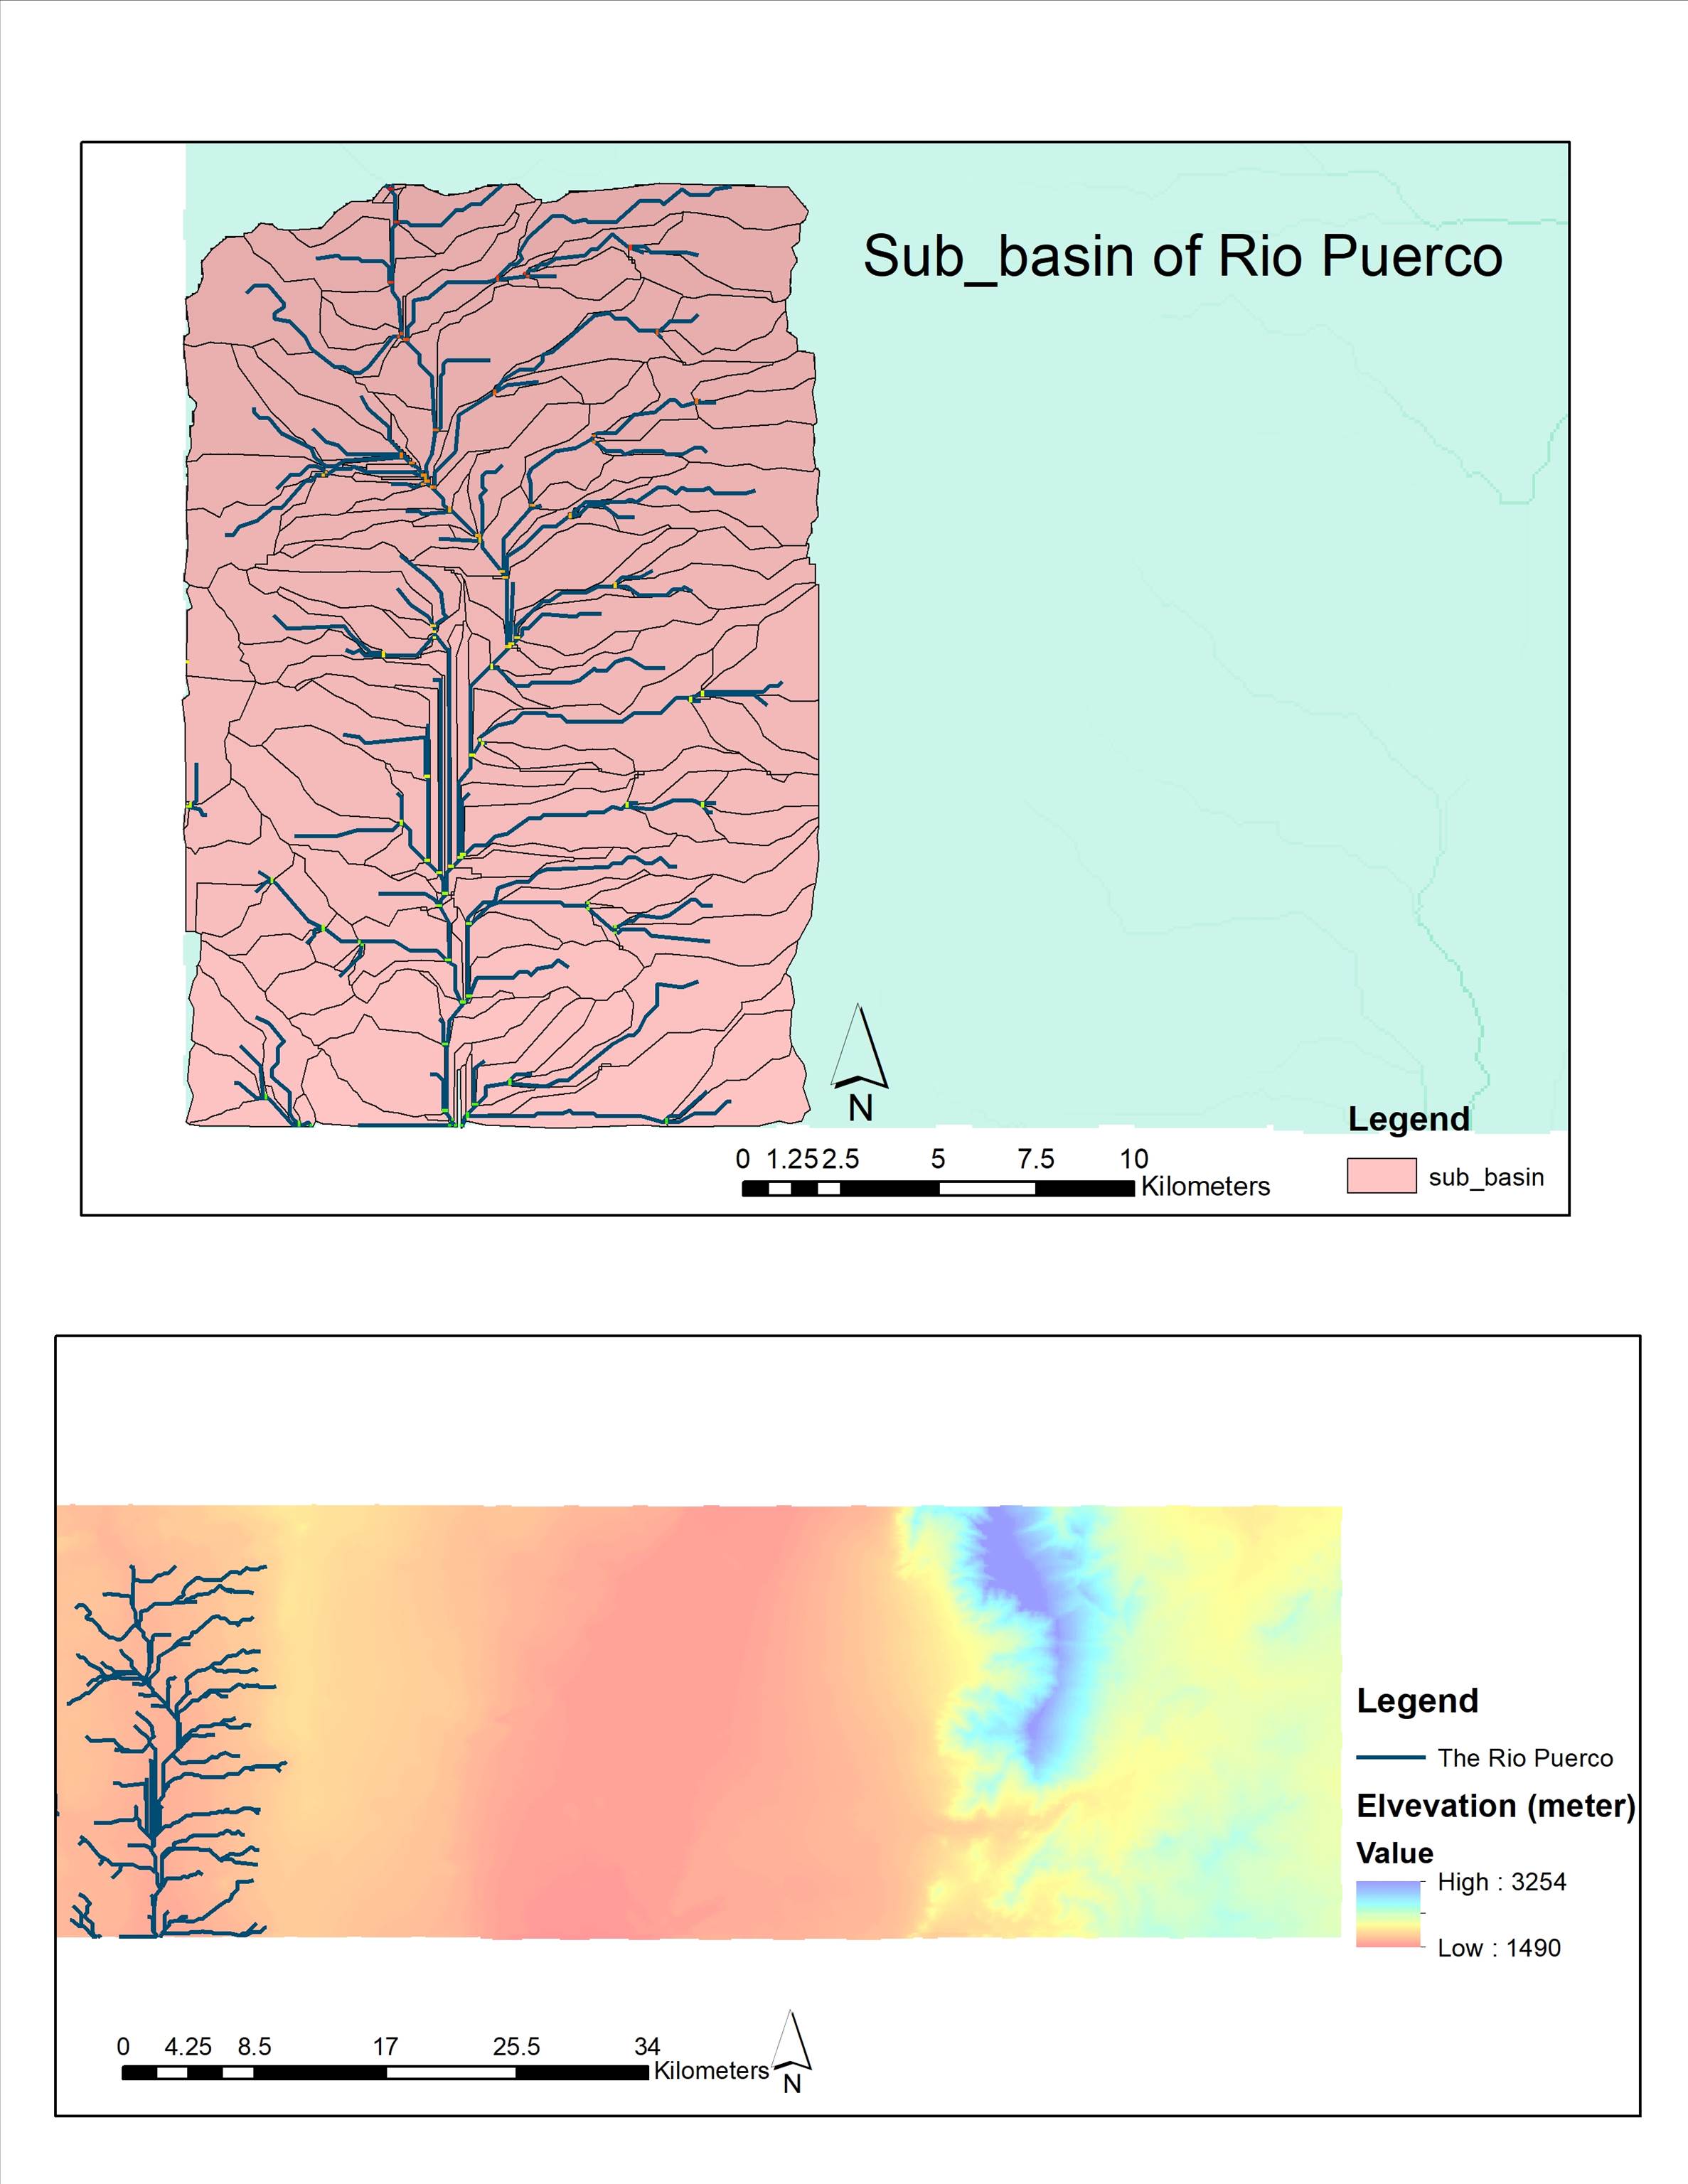
The given
files for this homework are interchange, bringing these kinds of files to
workspace is a little different from other kinds. We must use Arctoolbox > conversion > to coverage to make convert
these files then bring them to workspace.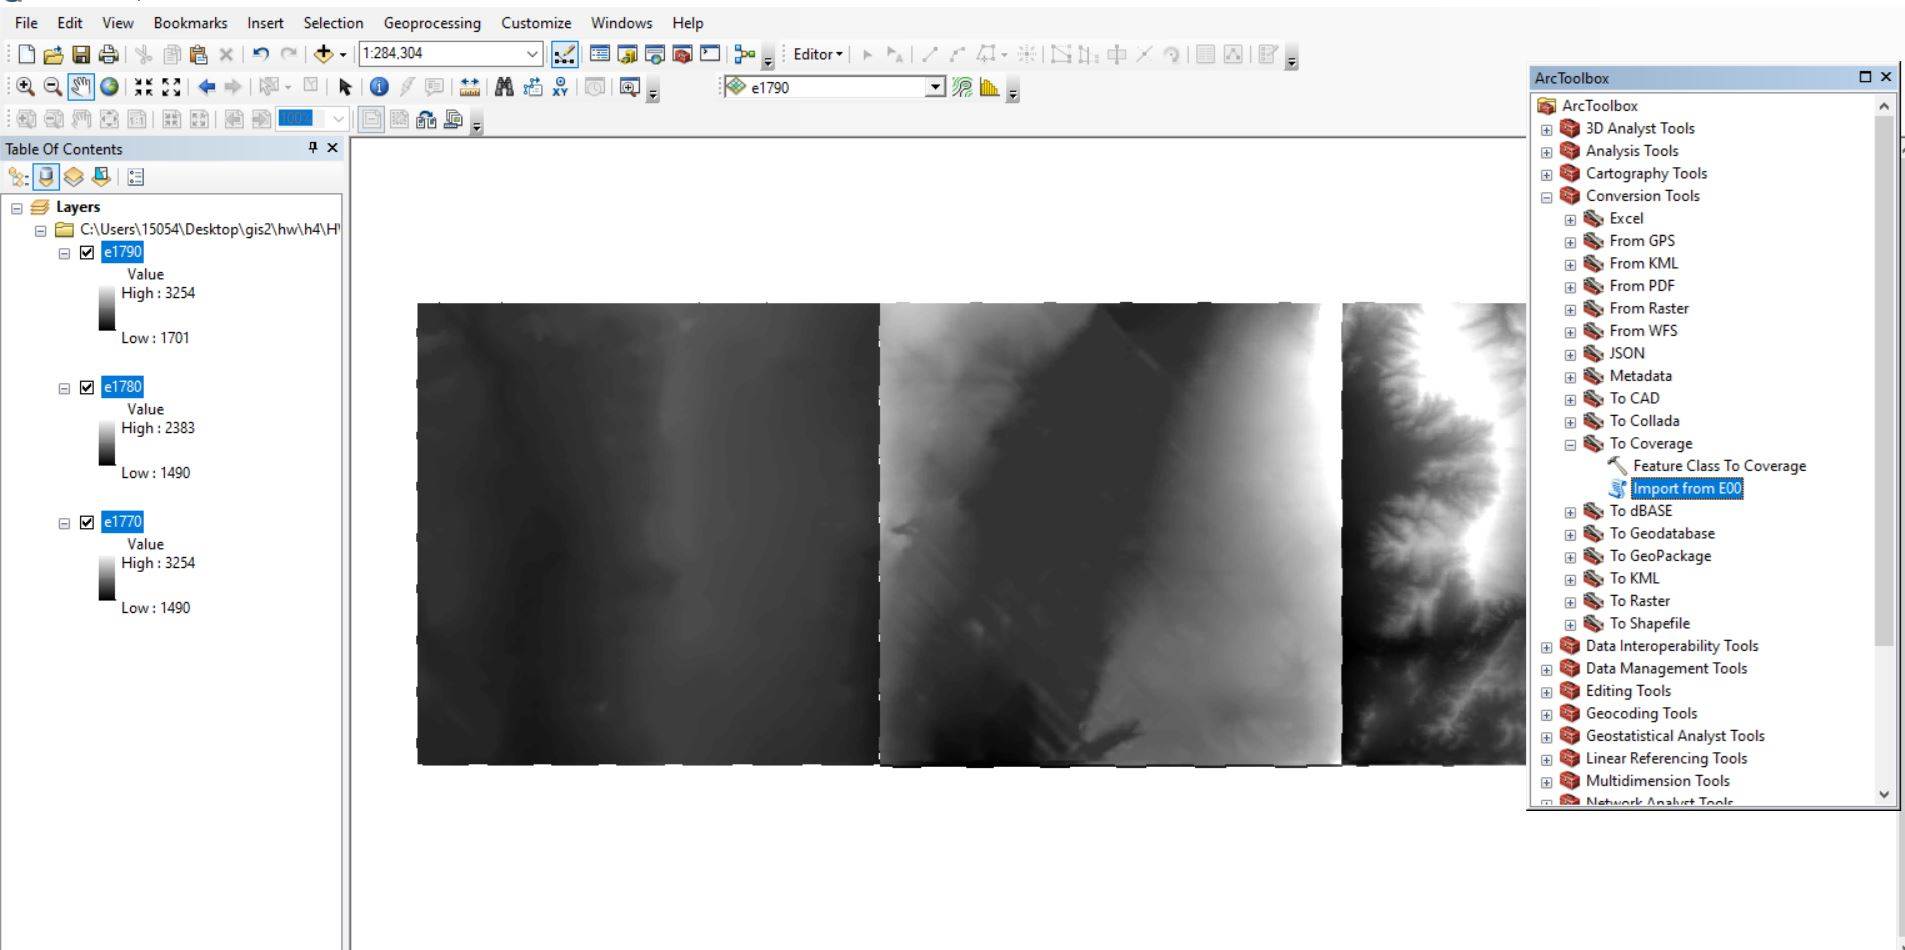
In the next step
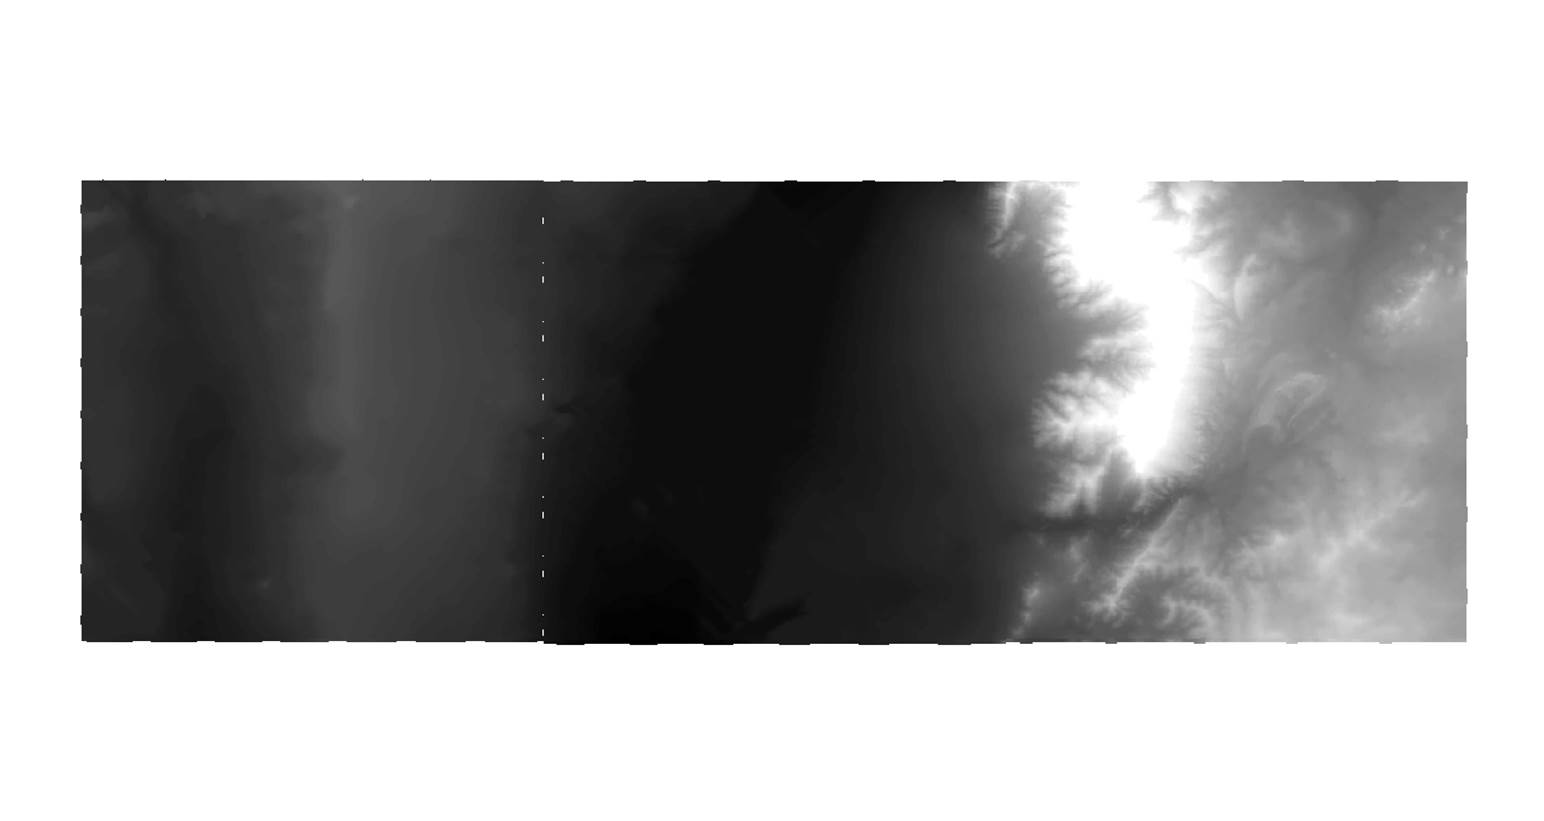
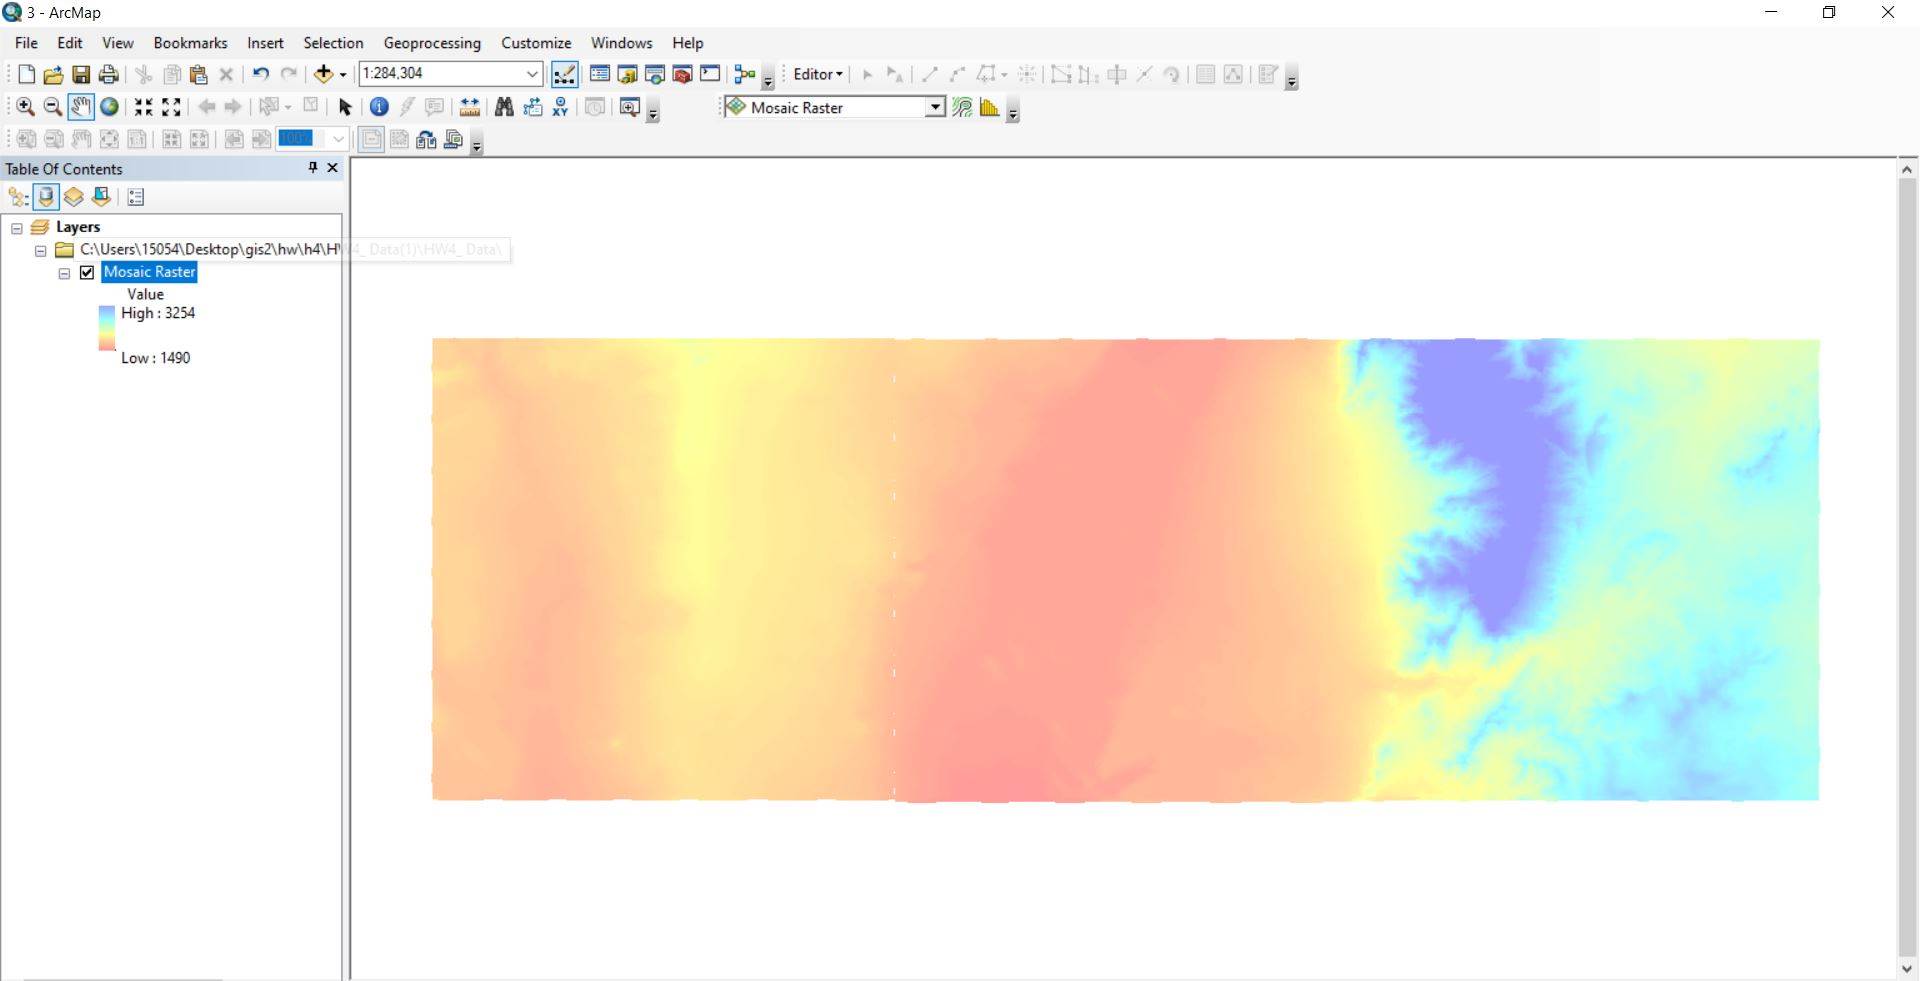
(d) we want to mosaic our raster date: the mosaic helps us to manage our data
by putting them into a single cell. As we mention this is kind of data managing
tool so Arctoolbox > Data managing tool >
raster >raster dataset> mosaic
Select all
three files and the target can be one of them. Then they are merged in the
target file.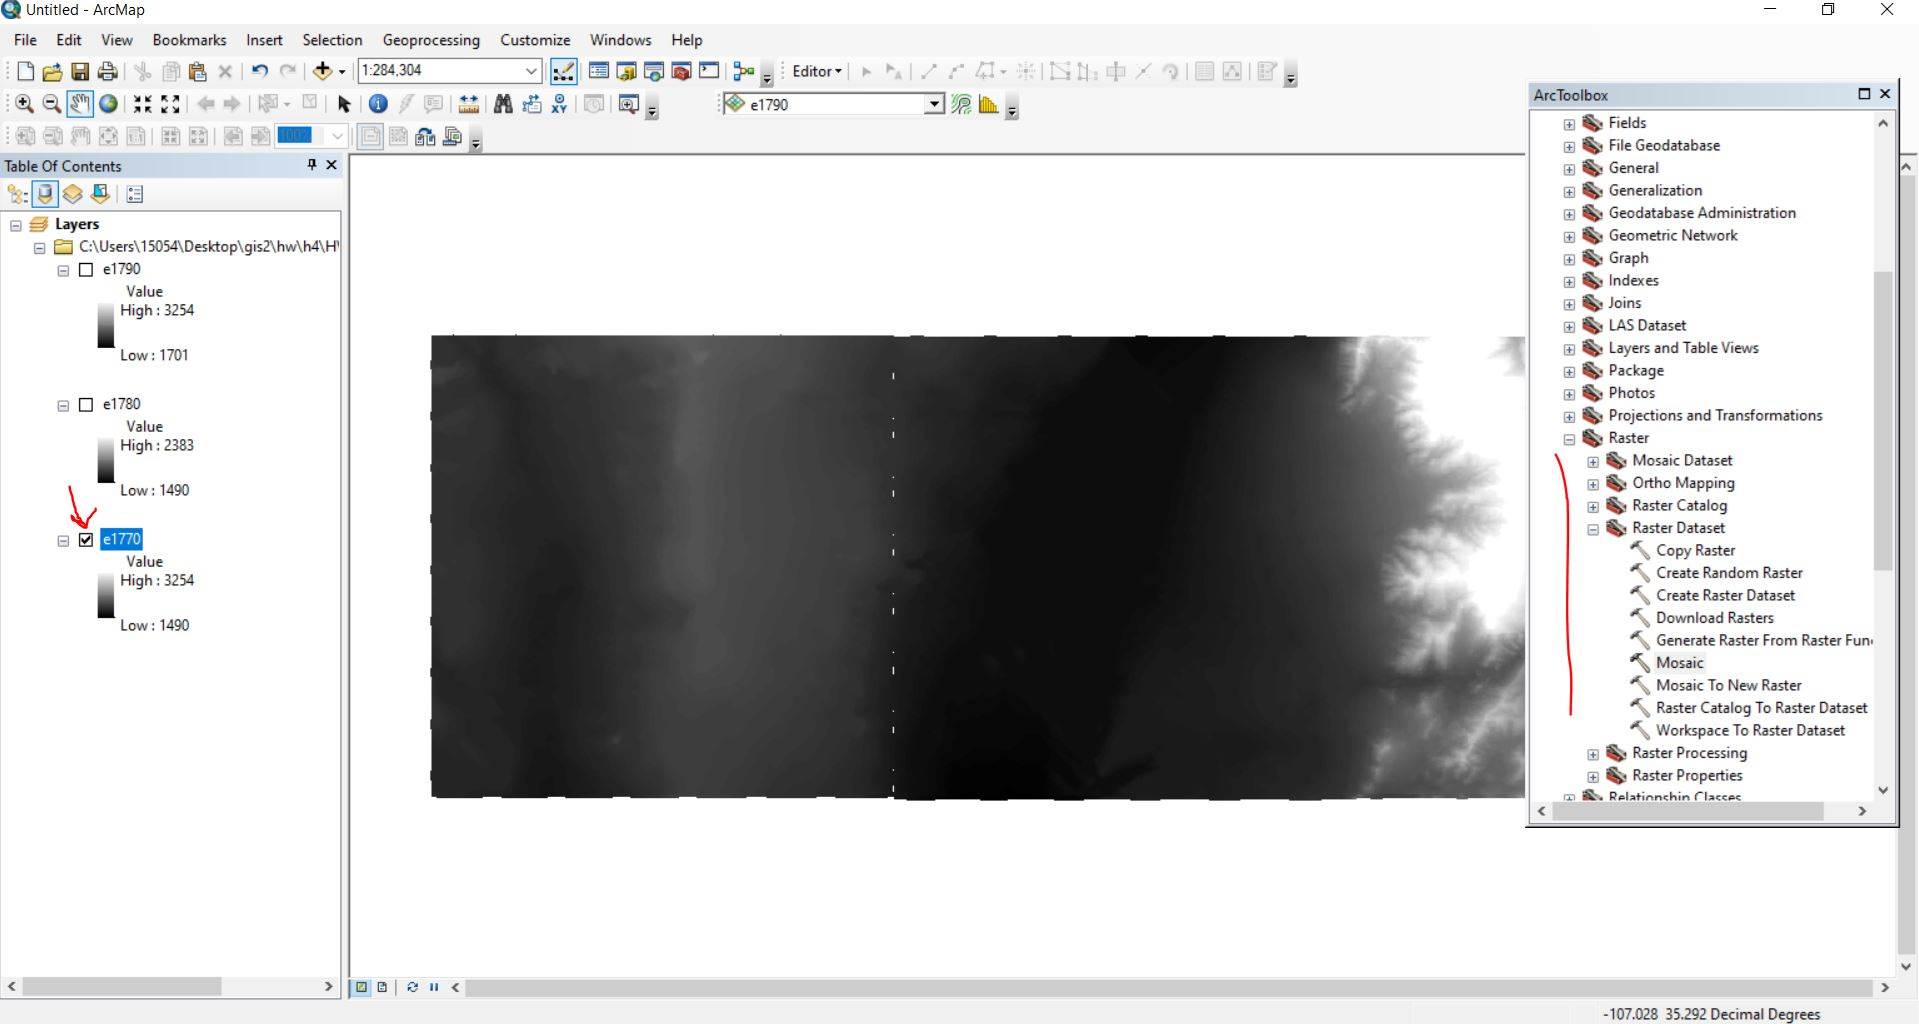
e) In the
next step we want to change the color and make the descriptive name to the
mosaic layer.
To change
color: Layer Properties > symbology
To change
name 2 separate clicks on name of layer
Also, we
remove the other layers and just keep the mosaic layer.
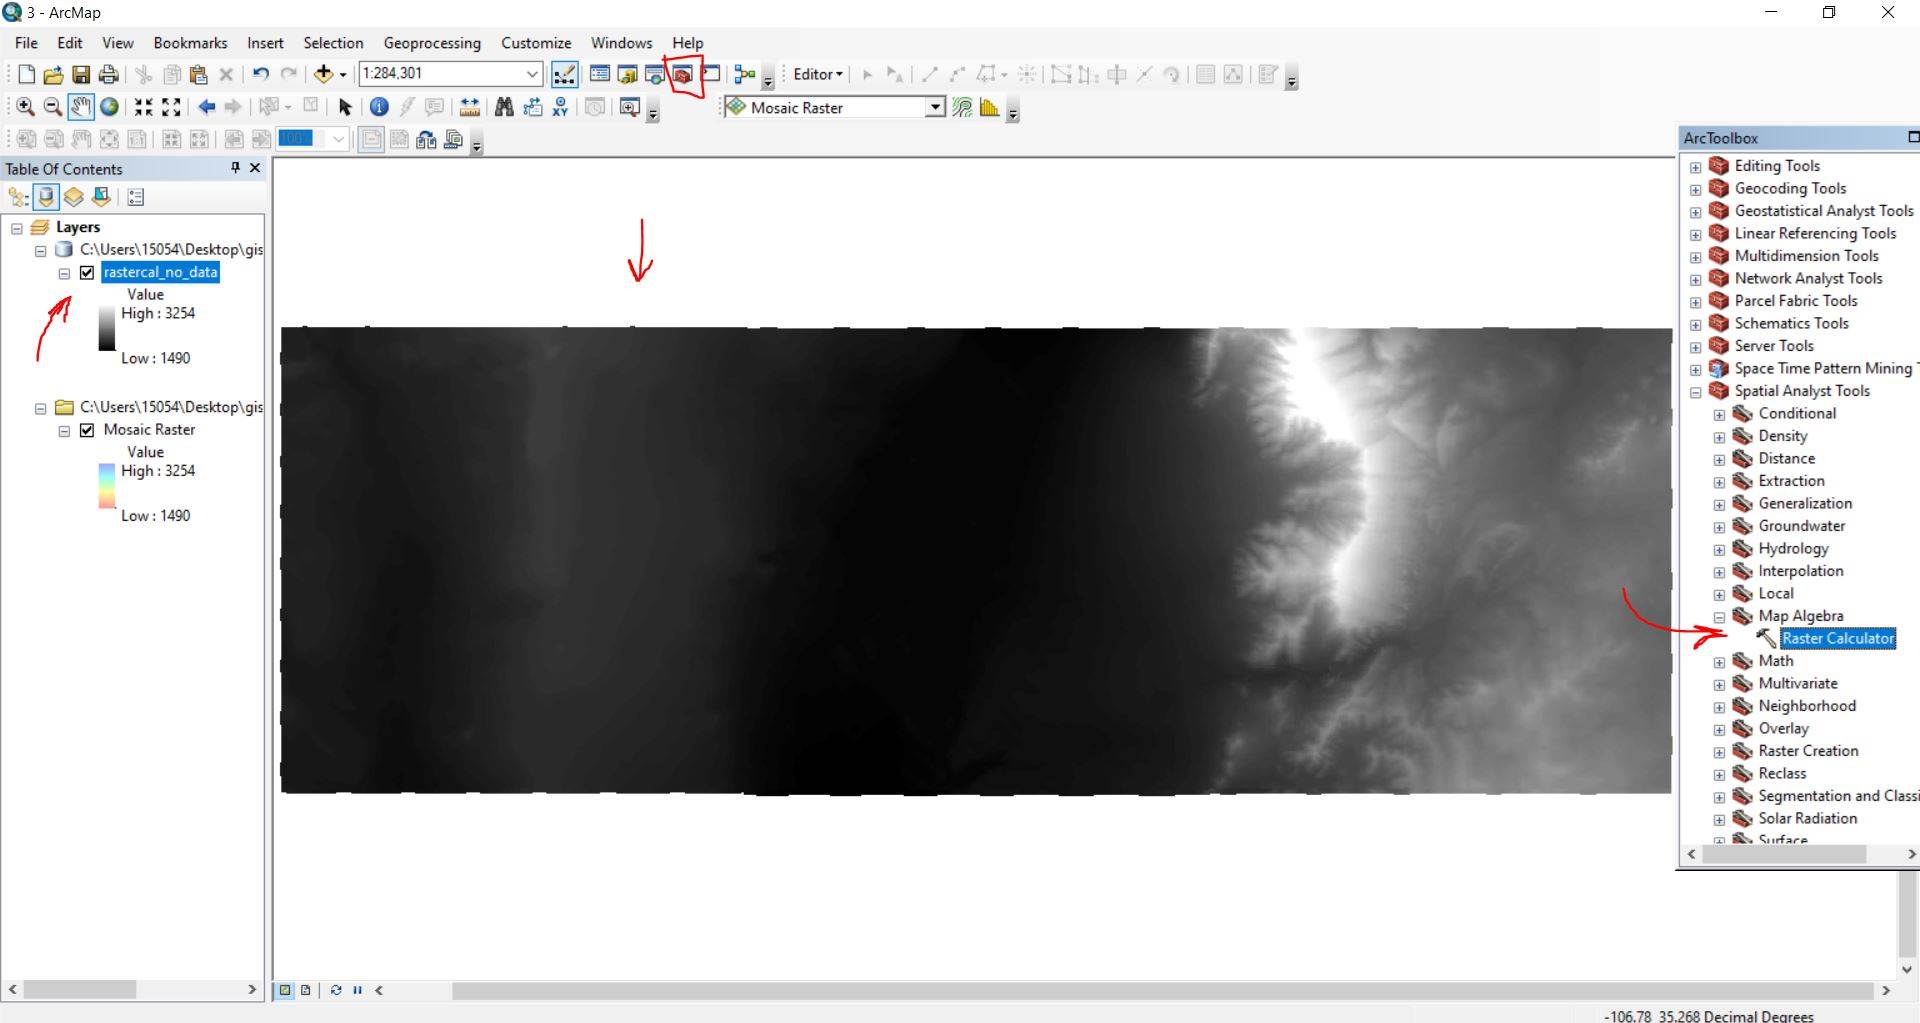
f) it this
step we calculate value for no data cells.
This is also
a kind of analysis so we can find the related bottom in Arctoolbox>
spatial analyst tool> Map algebra and write down the formula: Con(IsNull("calculation"),
FocalStatistics("calculation", NbrRectangle(4,4, "CELL"), "MEAN"),
"calculation"). It is worth mentioning the calculation is
Mosaic Raster for me. Output
should be saved in the Geodatabase file.
As we can see in the previous, some data
absented, by calculating the value for no-data-cells we can give them estimated
data according to its neighbor data. So, it this step the vacant line in the
map disappears.
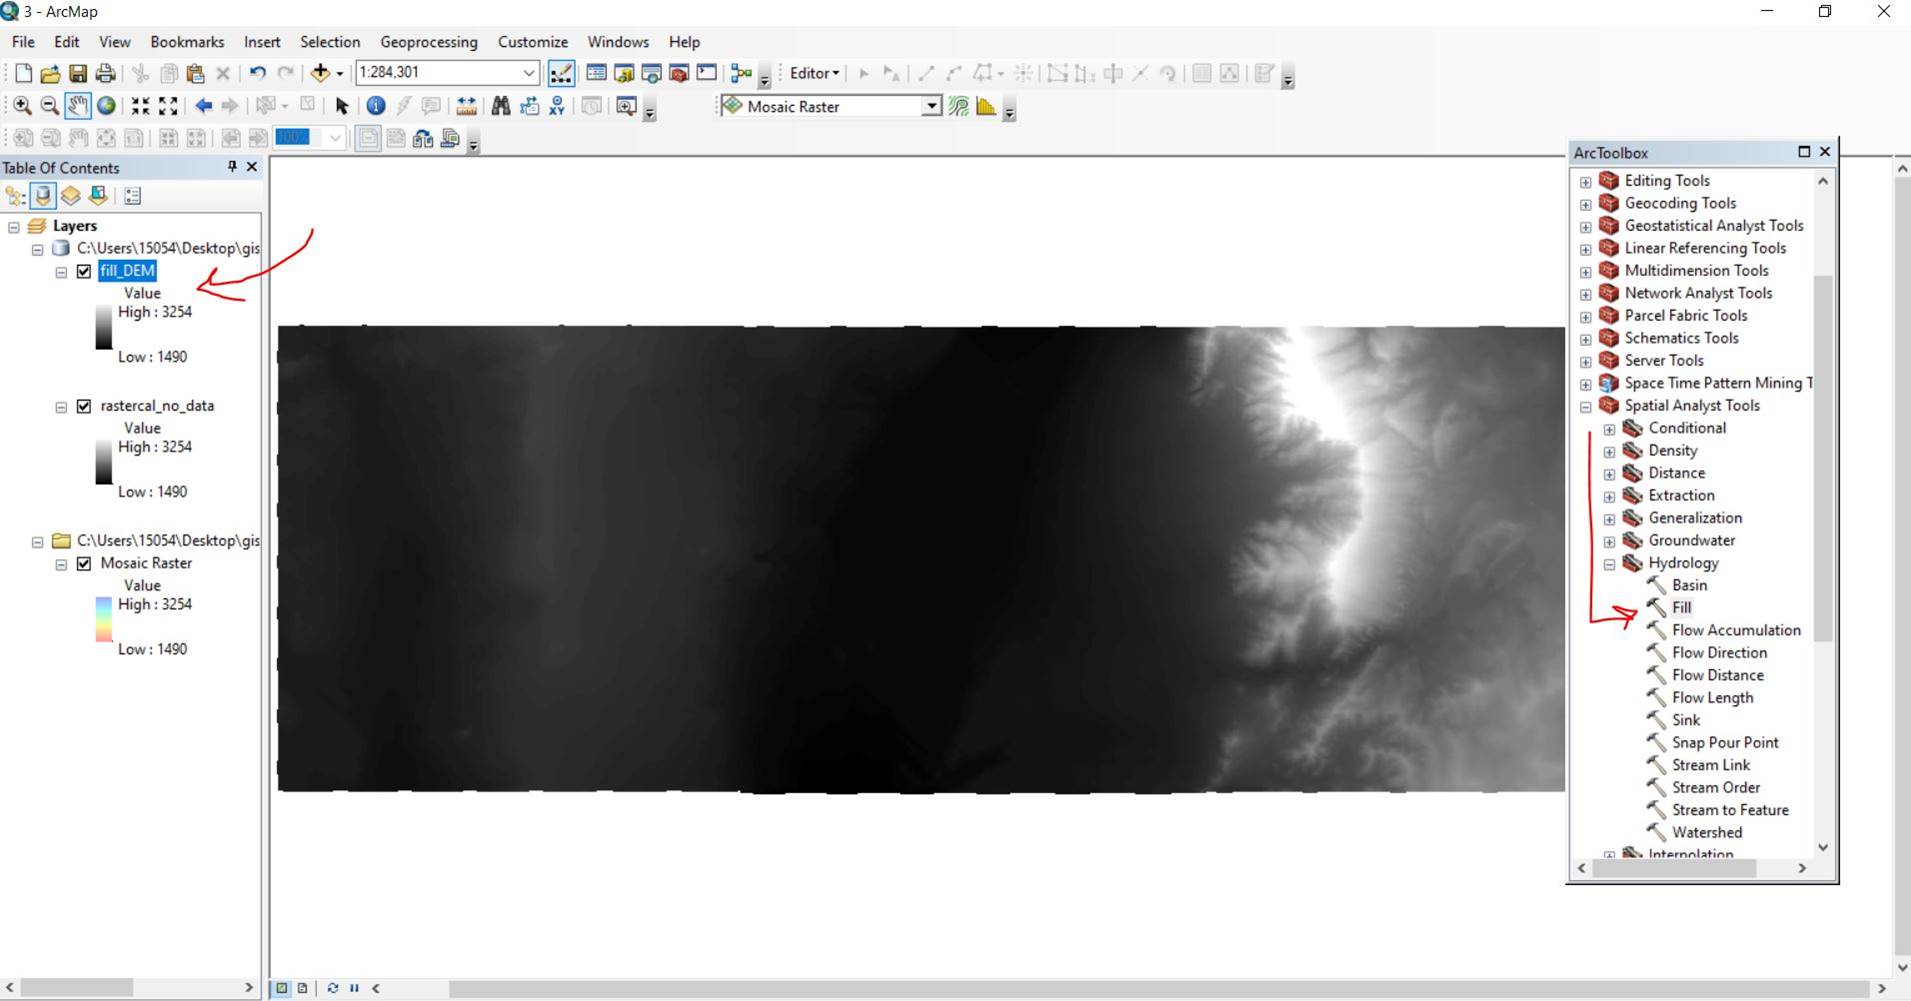
g) this is the first step to have DEM map for modeling hydrology data. Fills sinks in a surface raster to remove small imperfections in the data.
ArcToolbox tool: Spatial Analyst > Hydrology > Fill
Use rastcal_no_data as input which is most complete layer.
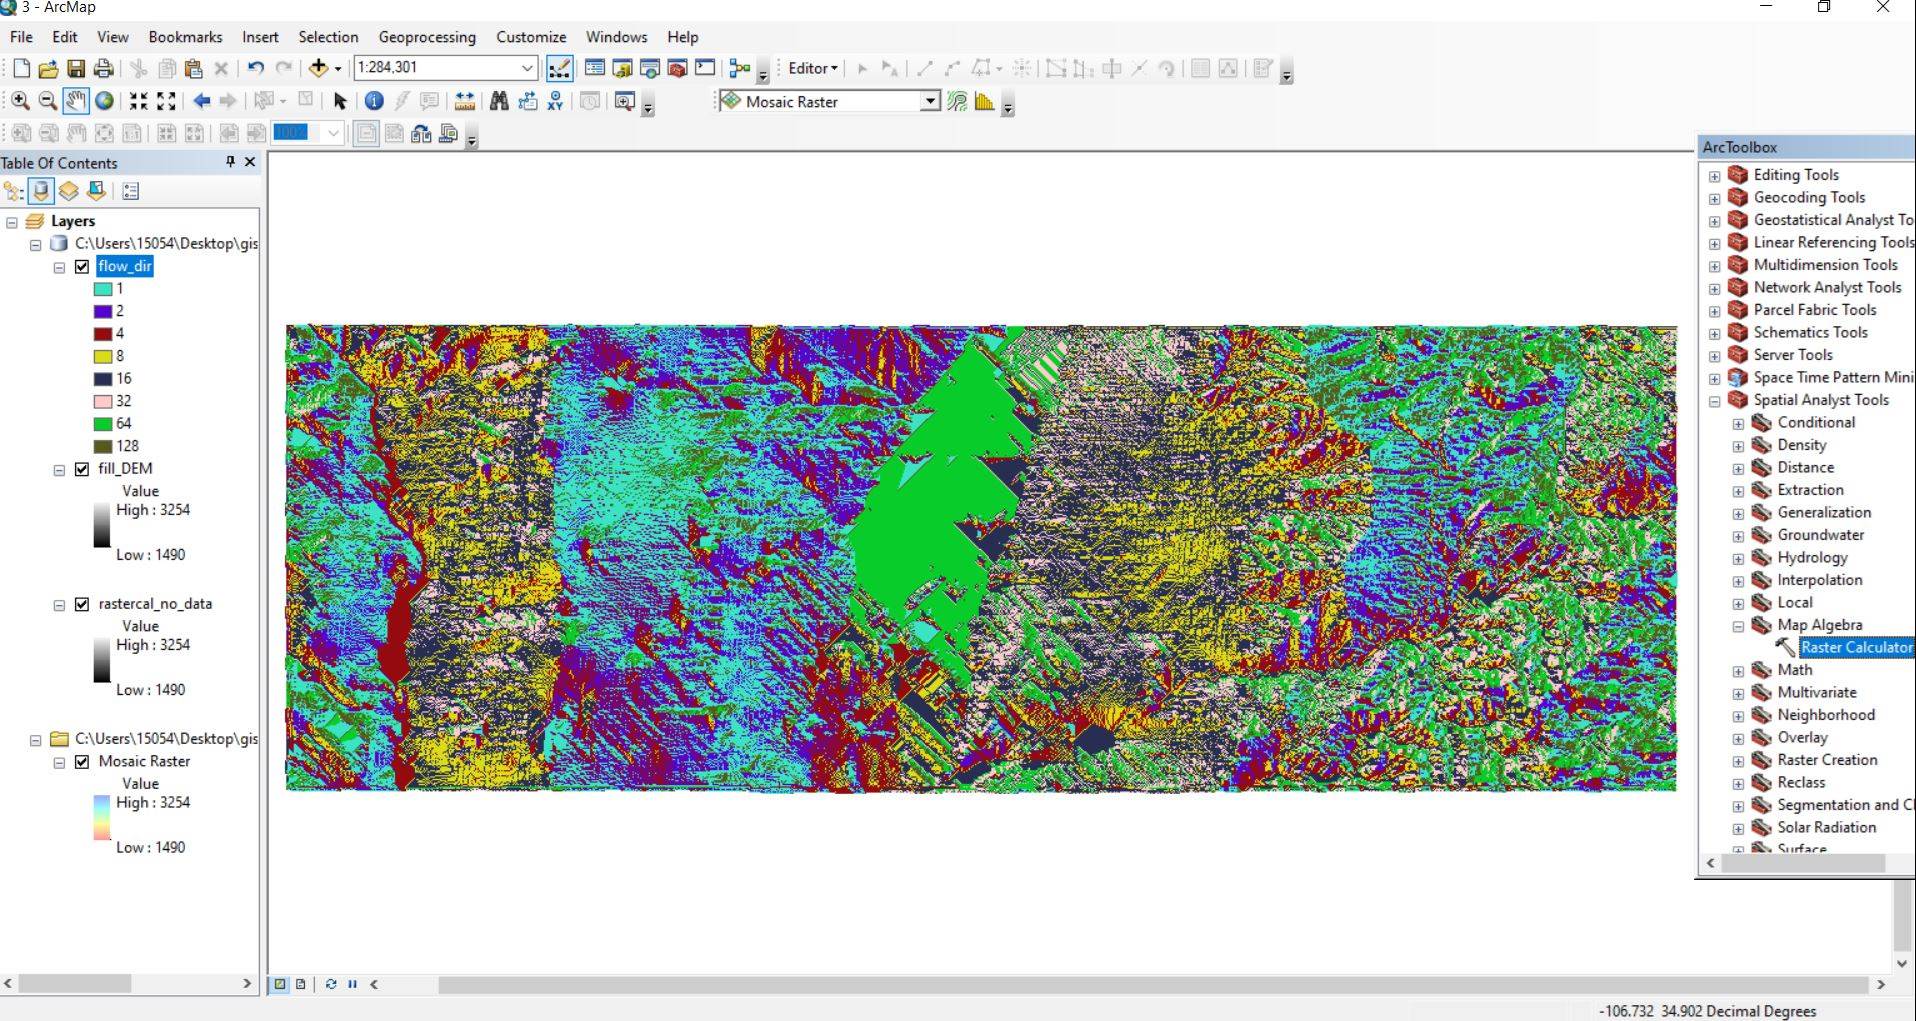
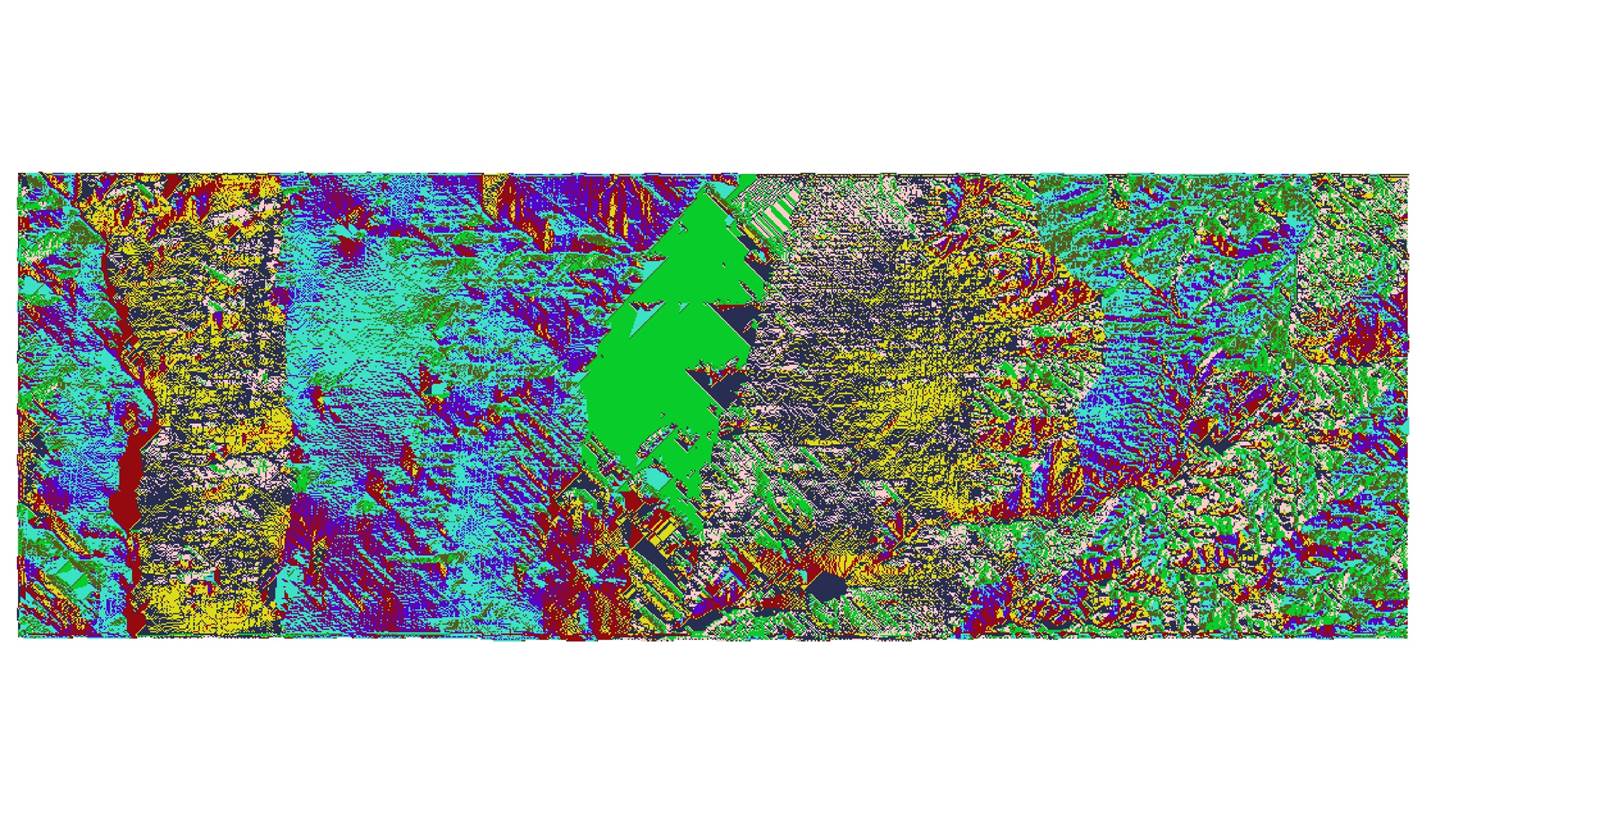
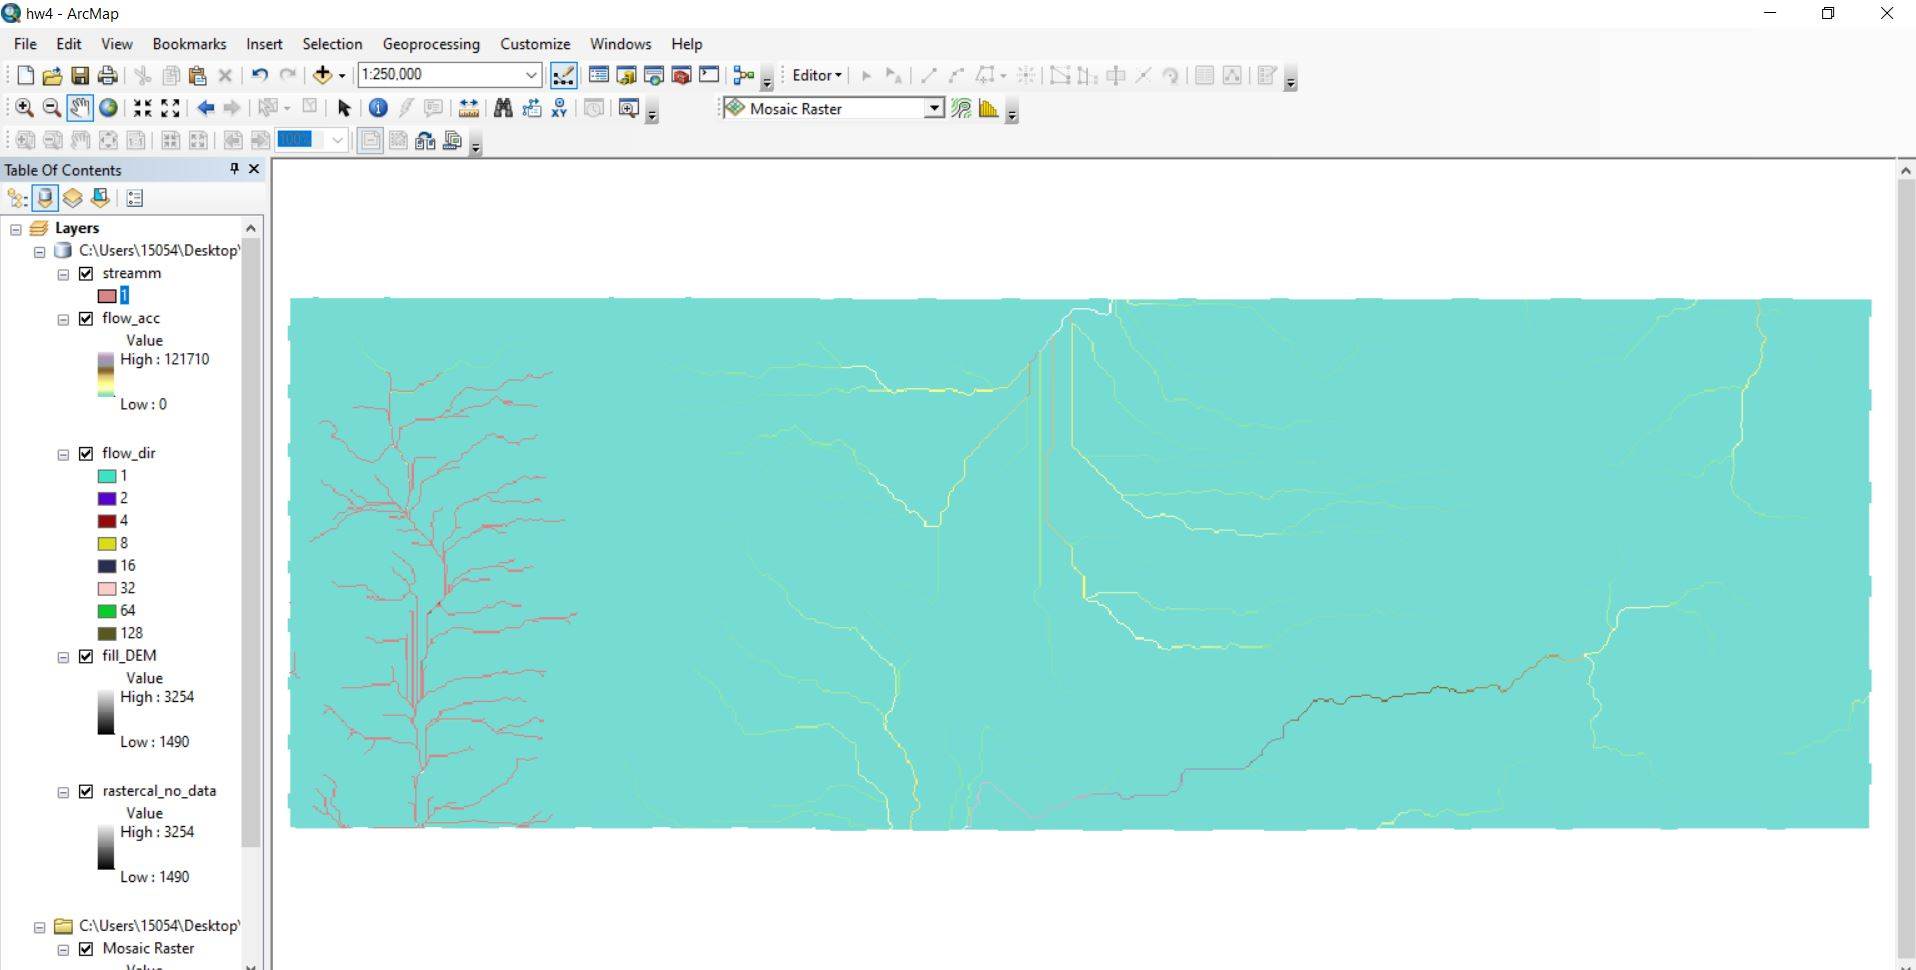
Part2 ) Hydrology Modeling
a) Flow
direction: there are 8 direction for flow direction which is shown by different
color.
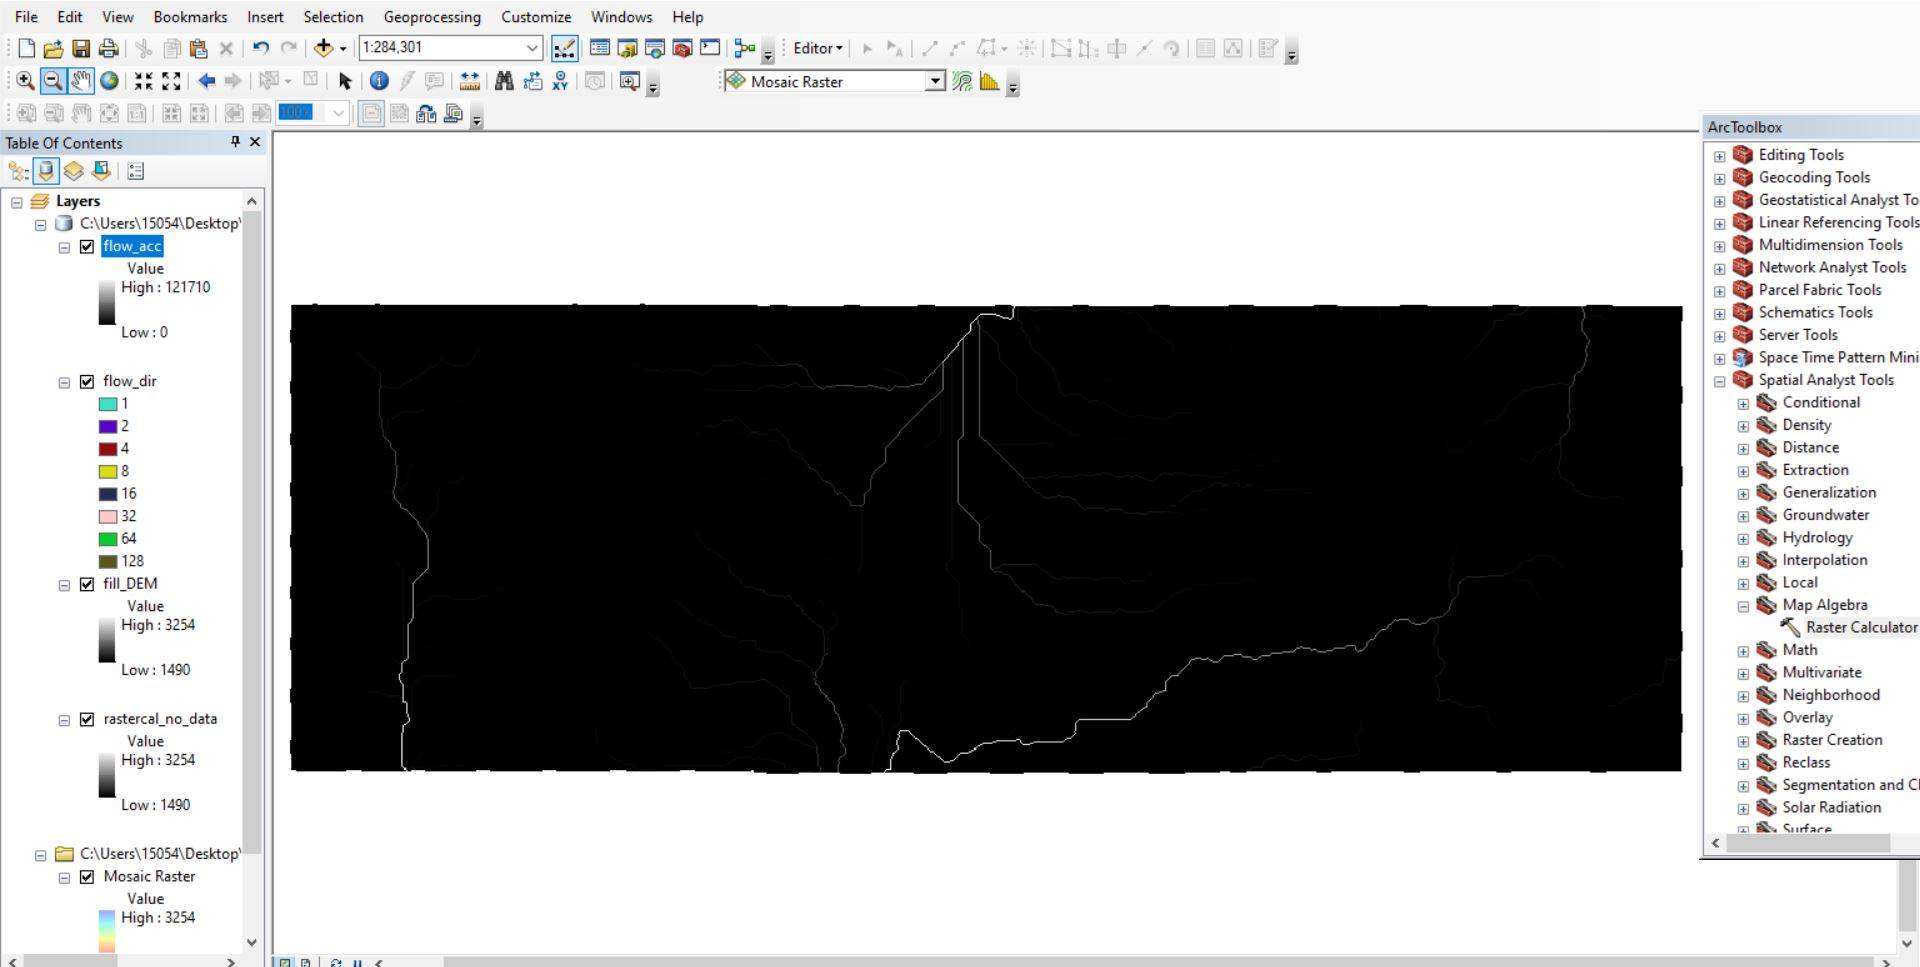
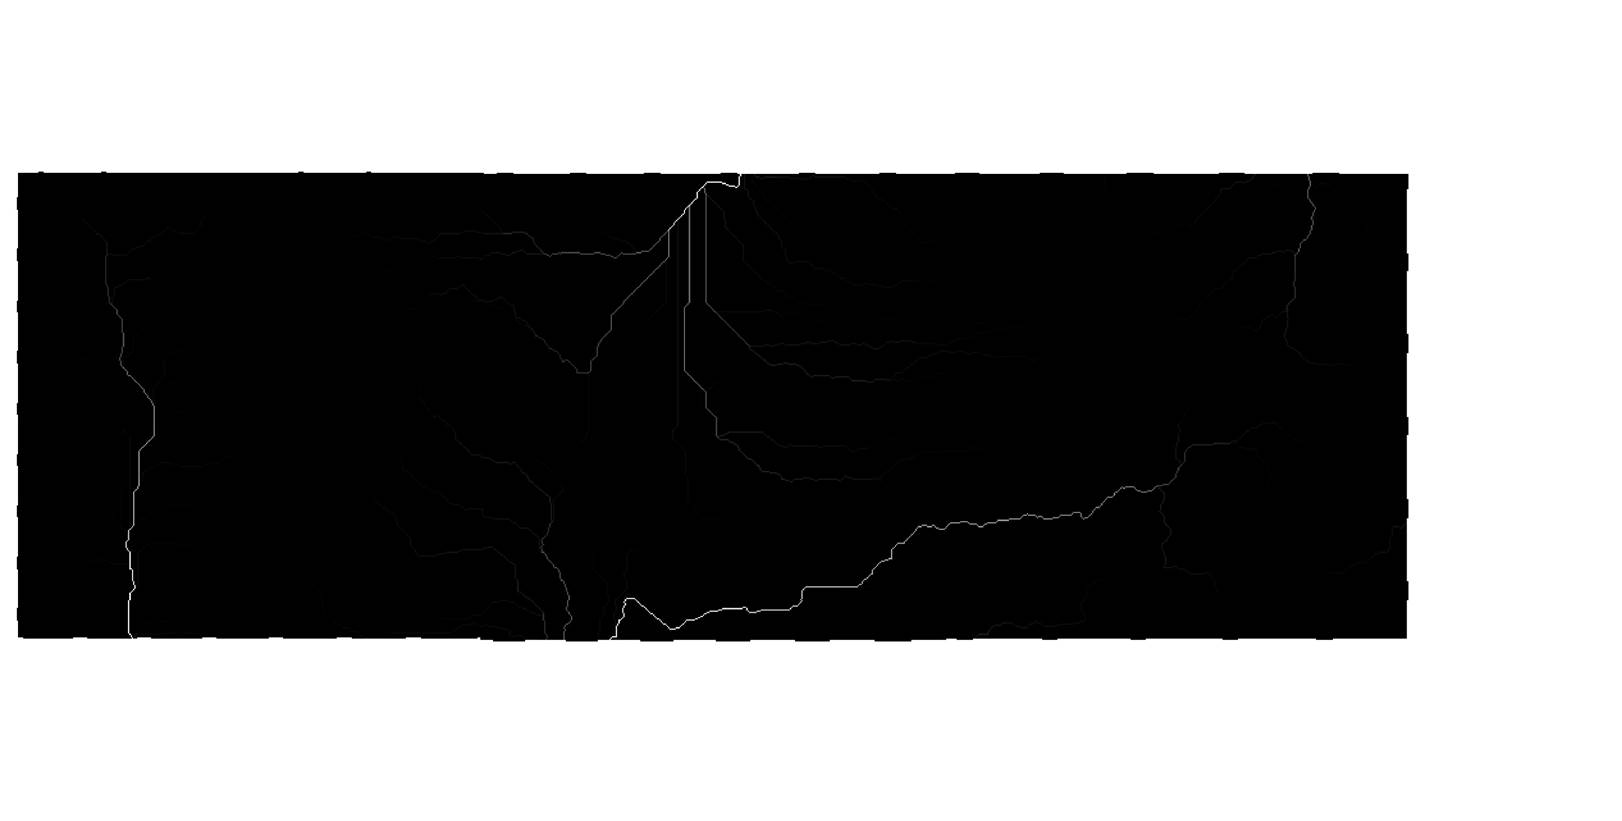
b) flow
accumulation: in this step we want to know about the weight of each cell.
In raster calculator we type:
FlowAccumulation("Flow_Dir")
That show us
where are sinks and drainages and etc.
c) after
making the flow direction and accumulation we want to show the stream.
What is stream? Our definition of stream is the cells with have more than 278 flow into itself. Soo the Con would be Con("Flow_Acc">278,1).
d) convert
stream to vector data: vector is easy to use and change.
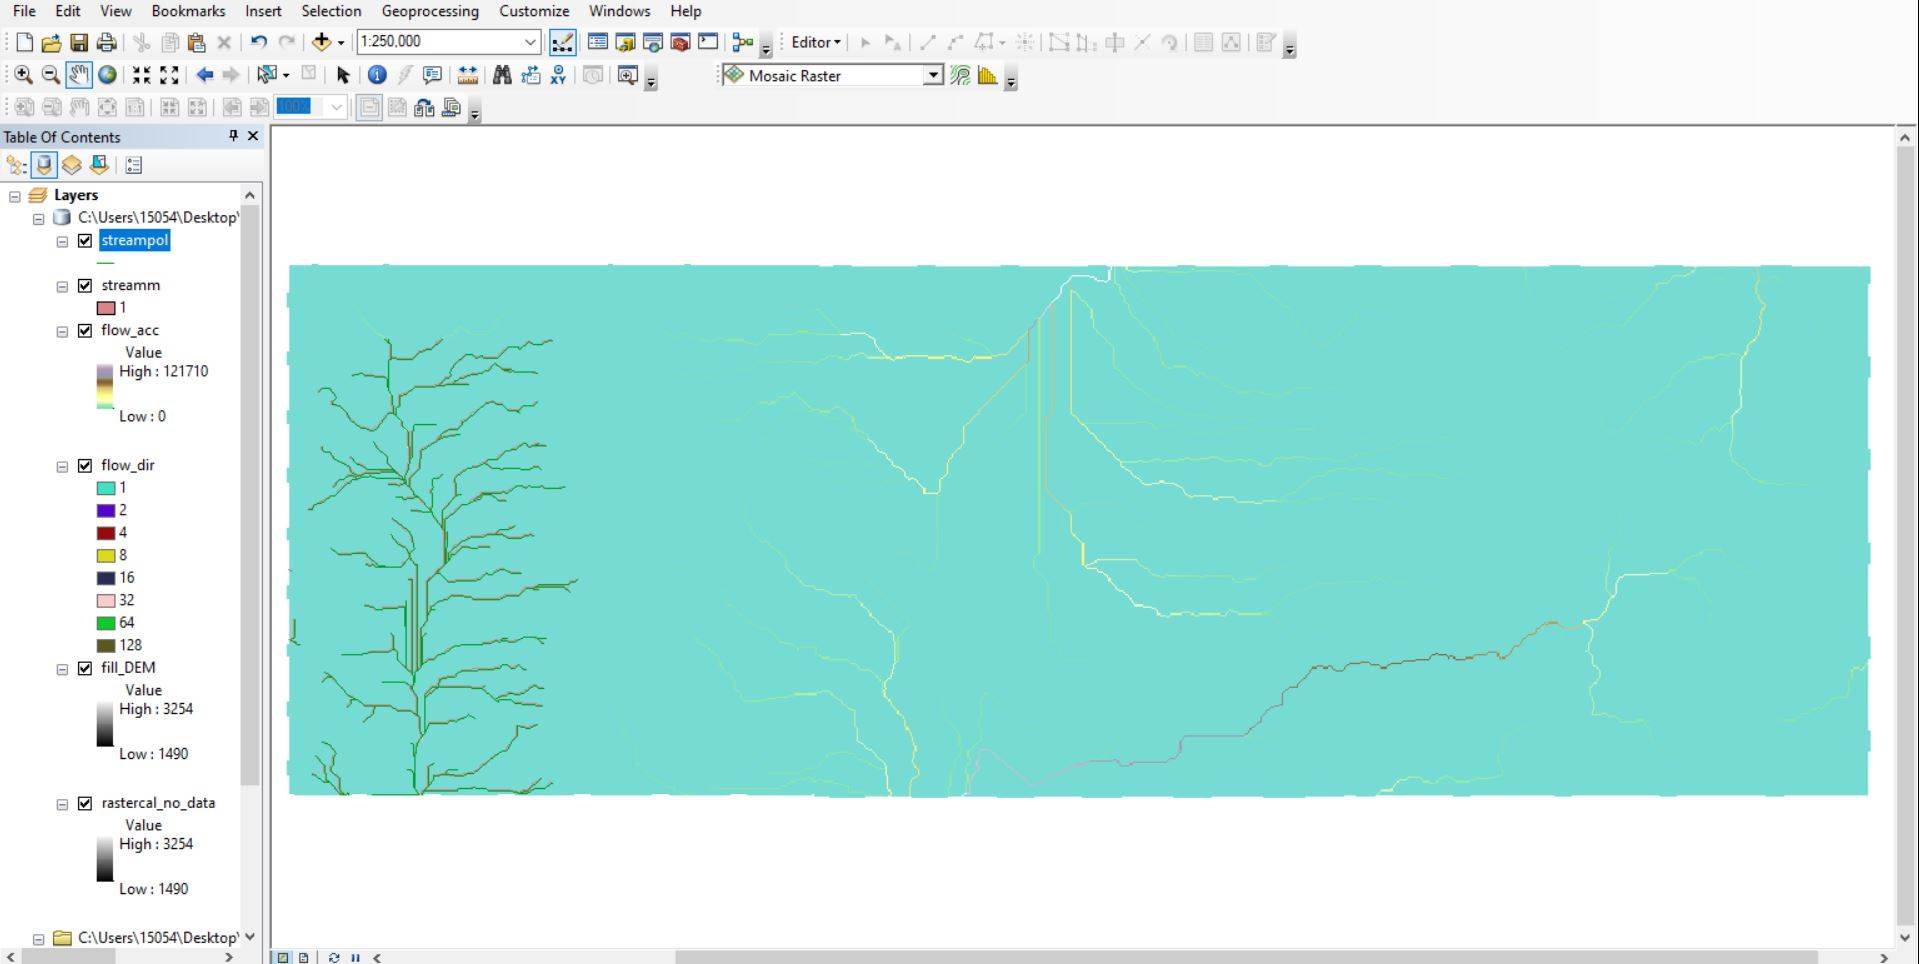
e) creating stream link to connect different
part to gather.
f) define
outlets, pour points.
The lowest
part of the DEM.
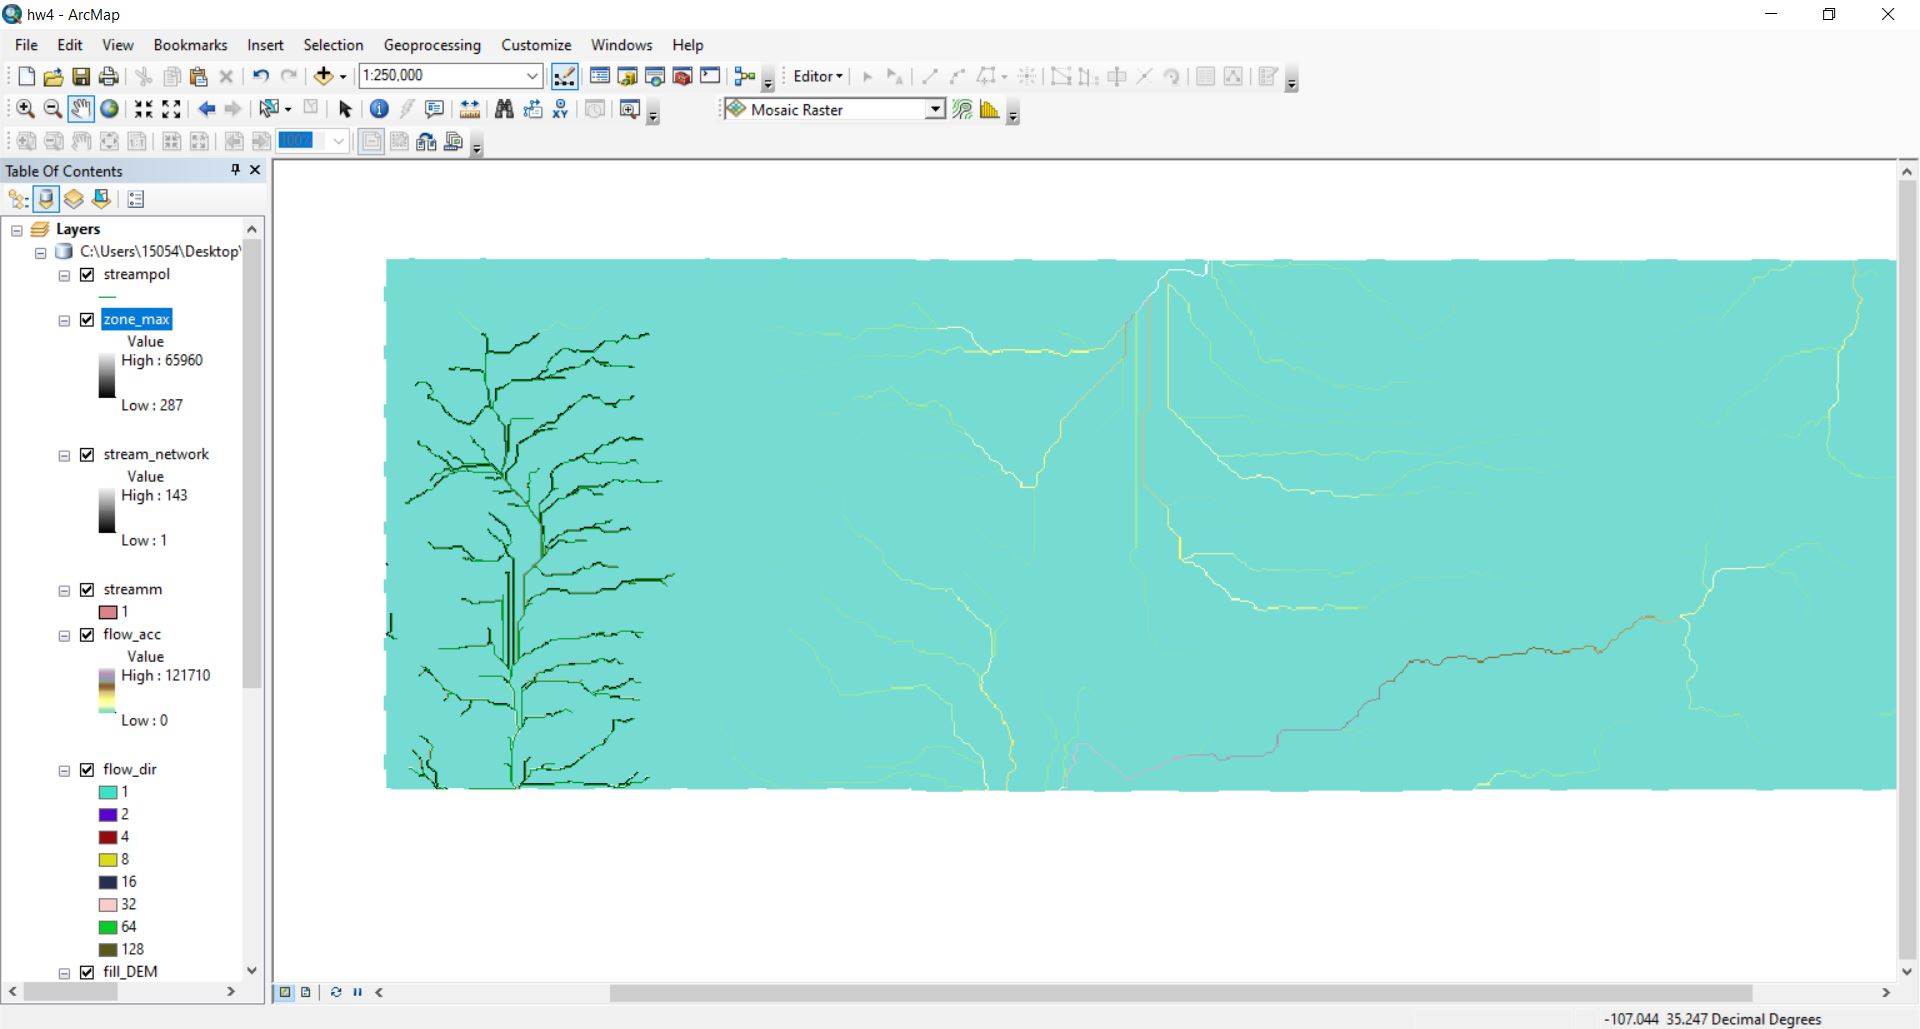
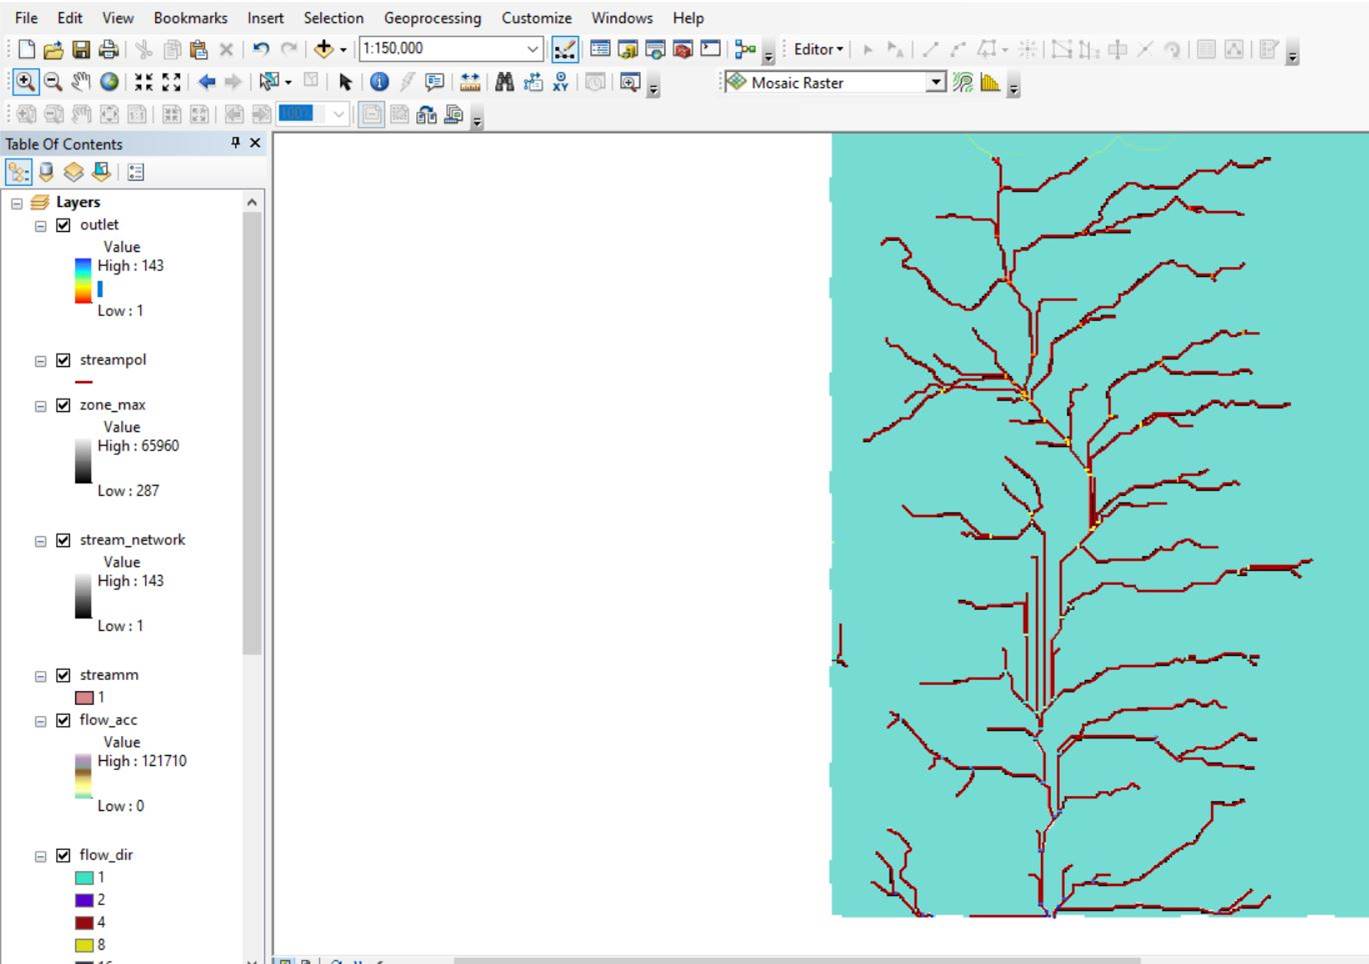
g)
watershed. To create watershed, we need flow direction and outlet:
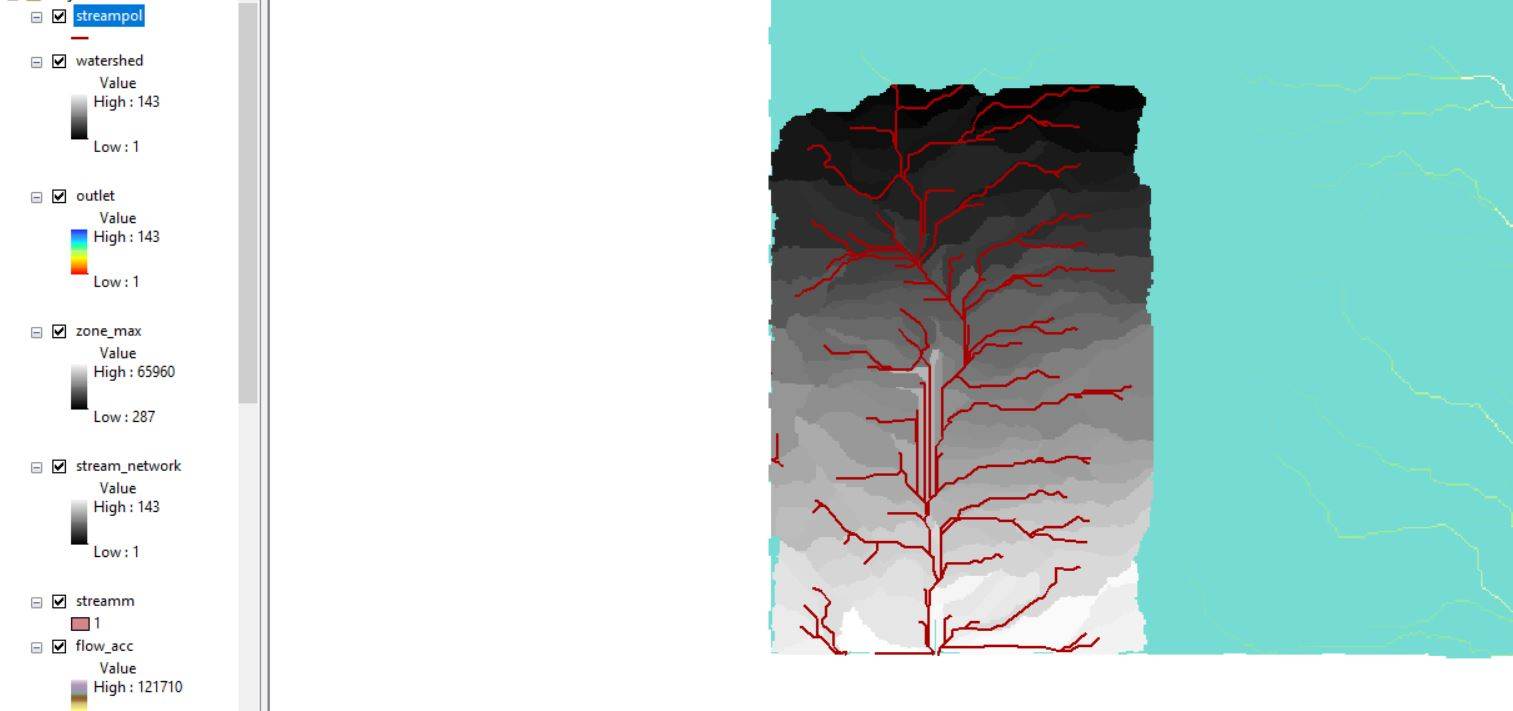
h) we did it in the previous part:
make the watershed to polyline to show the boundaries.
![]()
Final MAP:
![]()
![]()