Homework #1
Displaying Map Data
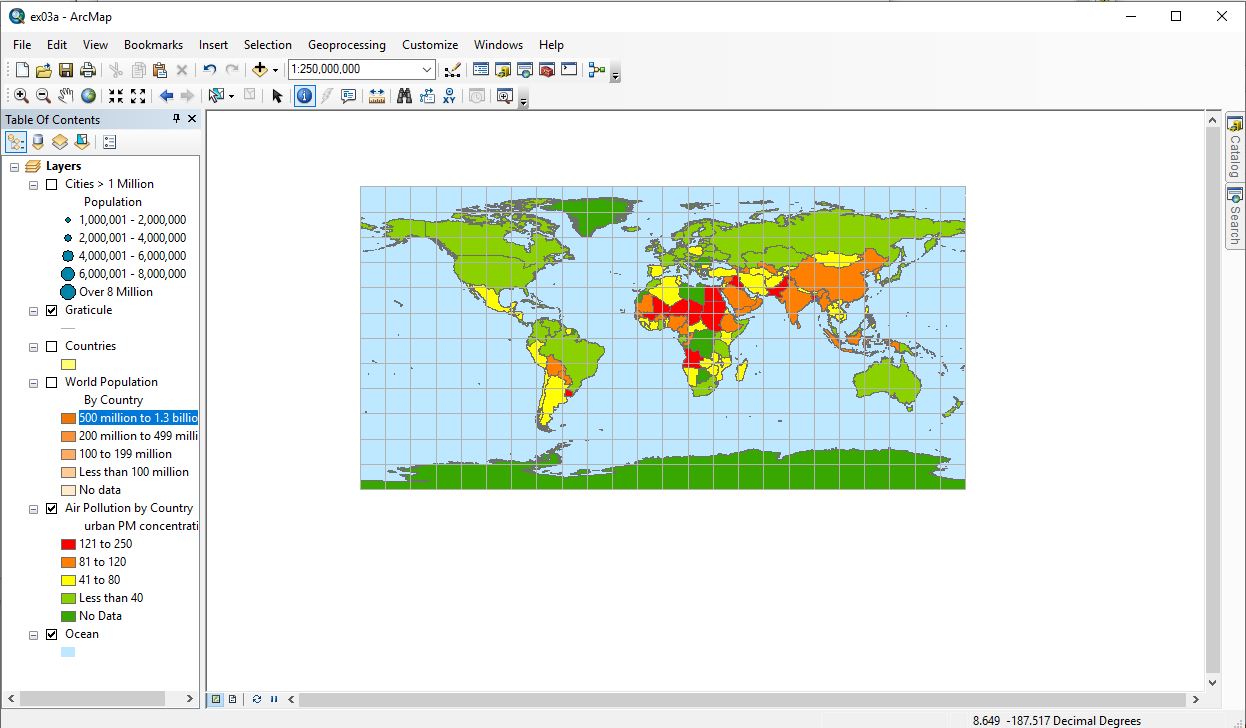
1. Open ARC Map and browse for more existing maps, in the open dialog box, browse to
C:\EsriPress\GTKarcGIS\Chapter03 folder to access ex03a.mxd.
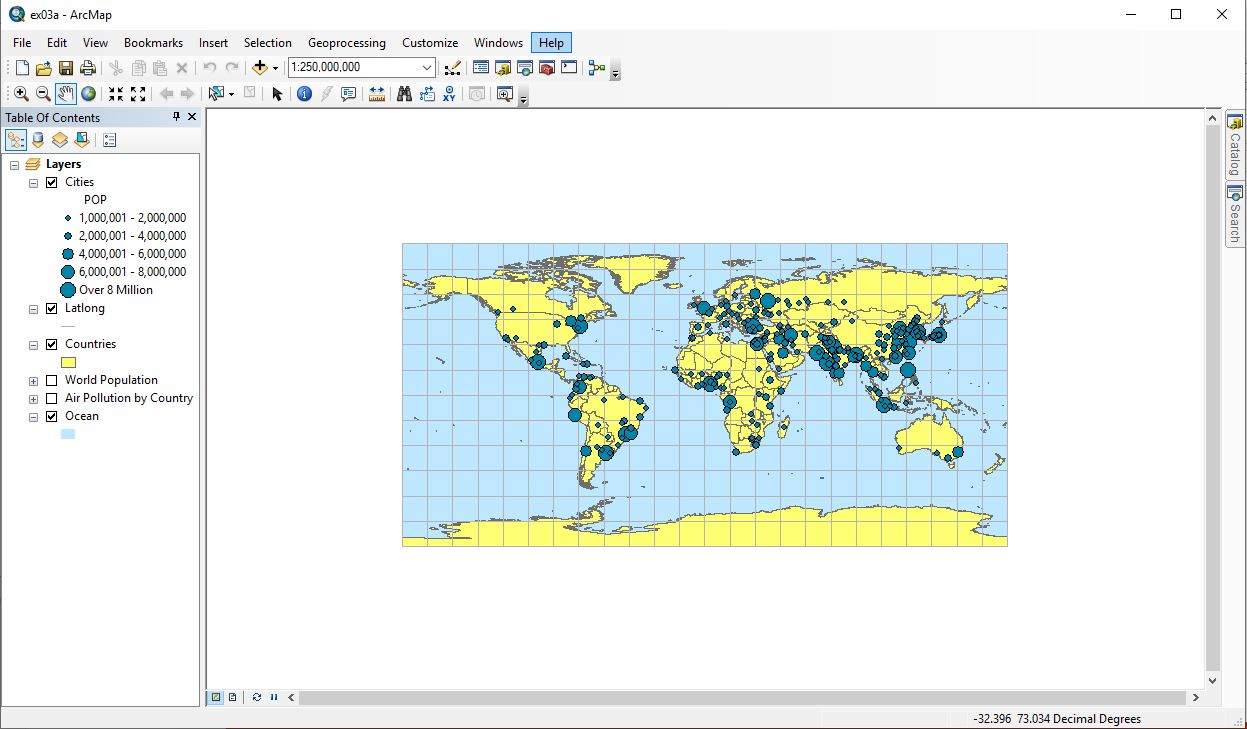
2. In table of Contents, select the check box next to Cities, and turn the layer off.
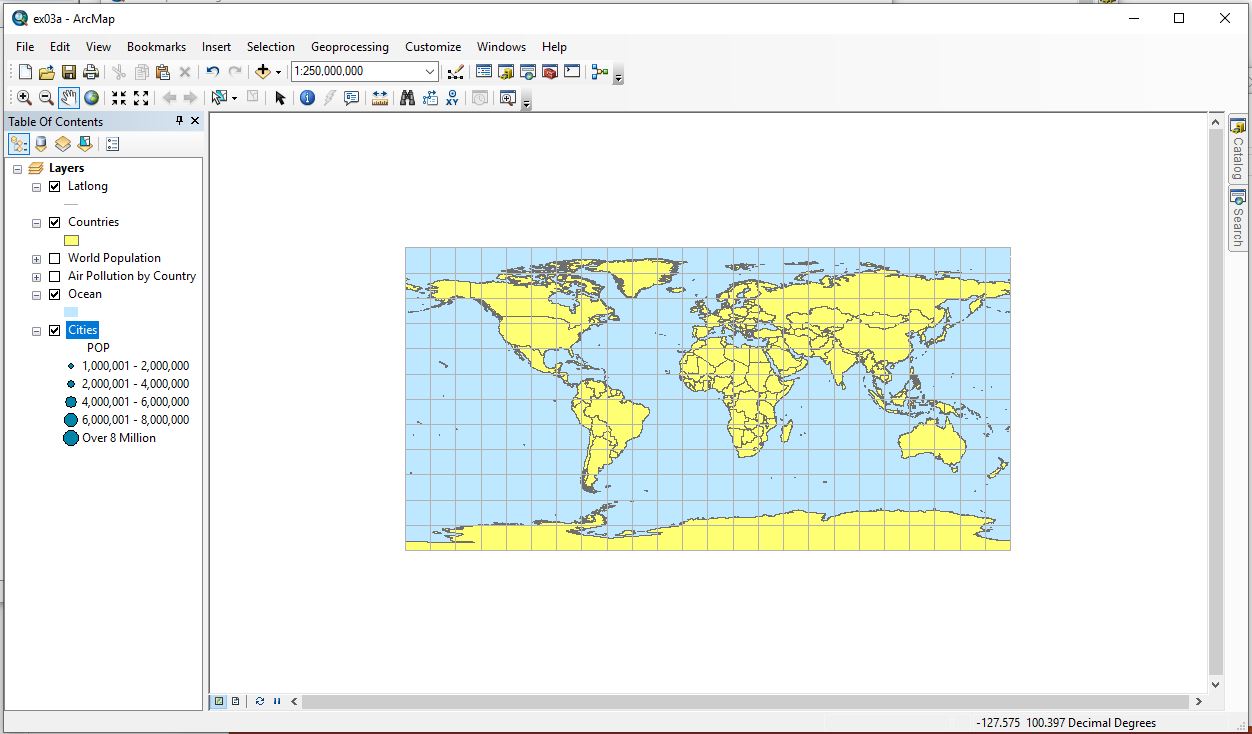
3. By moving Cities to the bottom, although its box is still checked, I can no longer
see the points representing population.
4. I left world population and air pollution by county unchecked so I could see if
I could see the points representing cities if those were turned off, but Countries
was still left checked.
5. In Table of Contents, right-click the Cities layer name.
6. Click properties to open the layer properties dialog box.
7. In General tab, rename Cities as “Cities > 1 Million”.
8. Click once to highlight POP, then click again to change it to say “Population”.
9. Turn off Cities > 1 Million layer, and check box next to “World Population”.
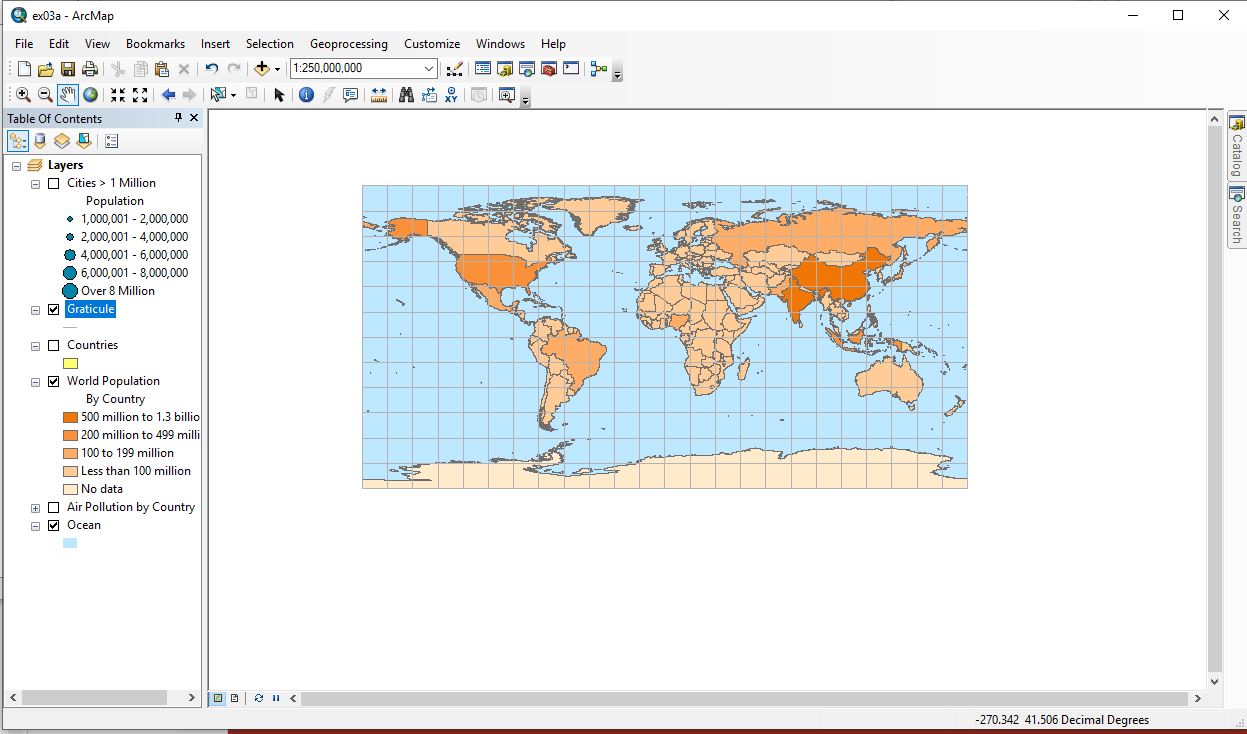
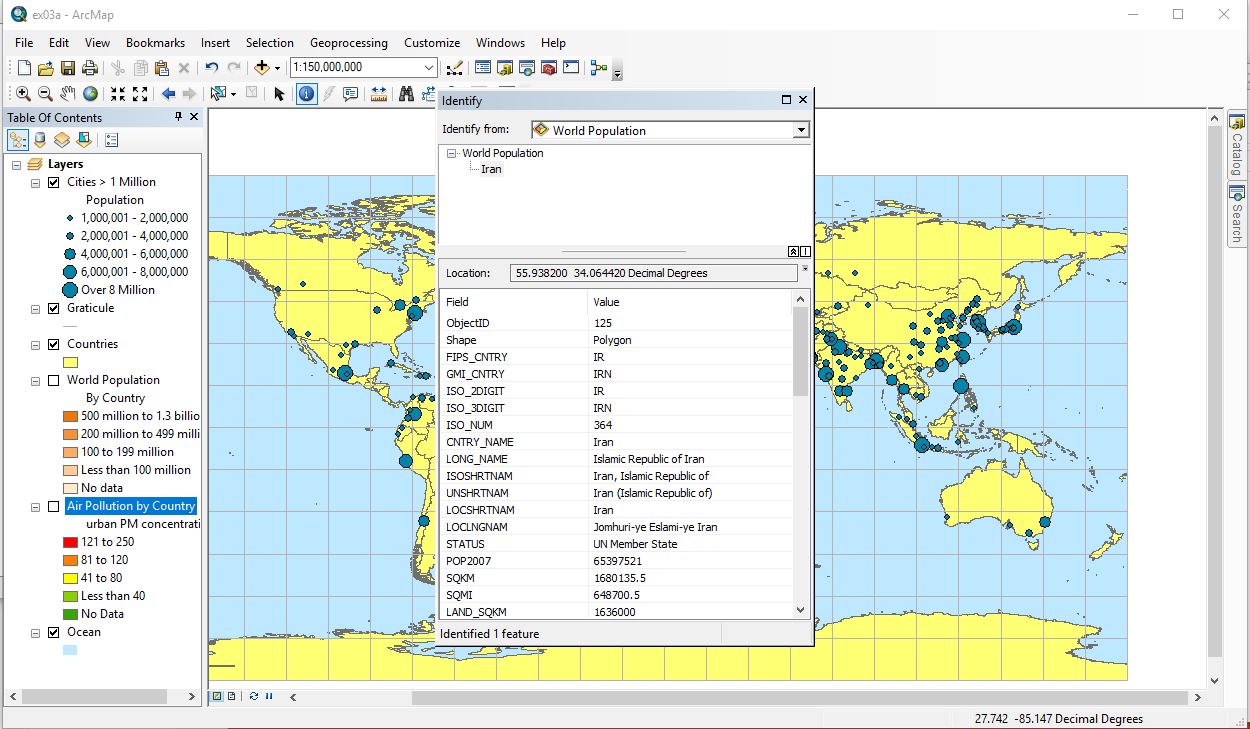
10. Select the “i” symbol (the identify tool) and click on desired area to see
information including Population and Country Name.
11. Using this feature, we find that India and the U.S. have populations greater
than 5 Million. They are visualized in the above map, having the deeper orange color.
Close the Identify window and turn off “world population” layer.
12. Turn on “Air Pollution” layer.
13. Comparing “World Population” and “Air pollution” layers shows that population
and pollution levels of air do not necessarily coincide, perhaps due to more stringent
regulation on air pollution in areas with higher populations.
14. Using Hand symbol, drag map to area of Iran.
15. Use Identify Tool and click on Iran on the map to see pertinent info including the
ISO #364.
Using Basic Tools
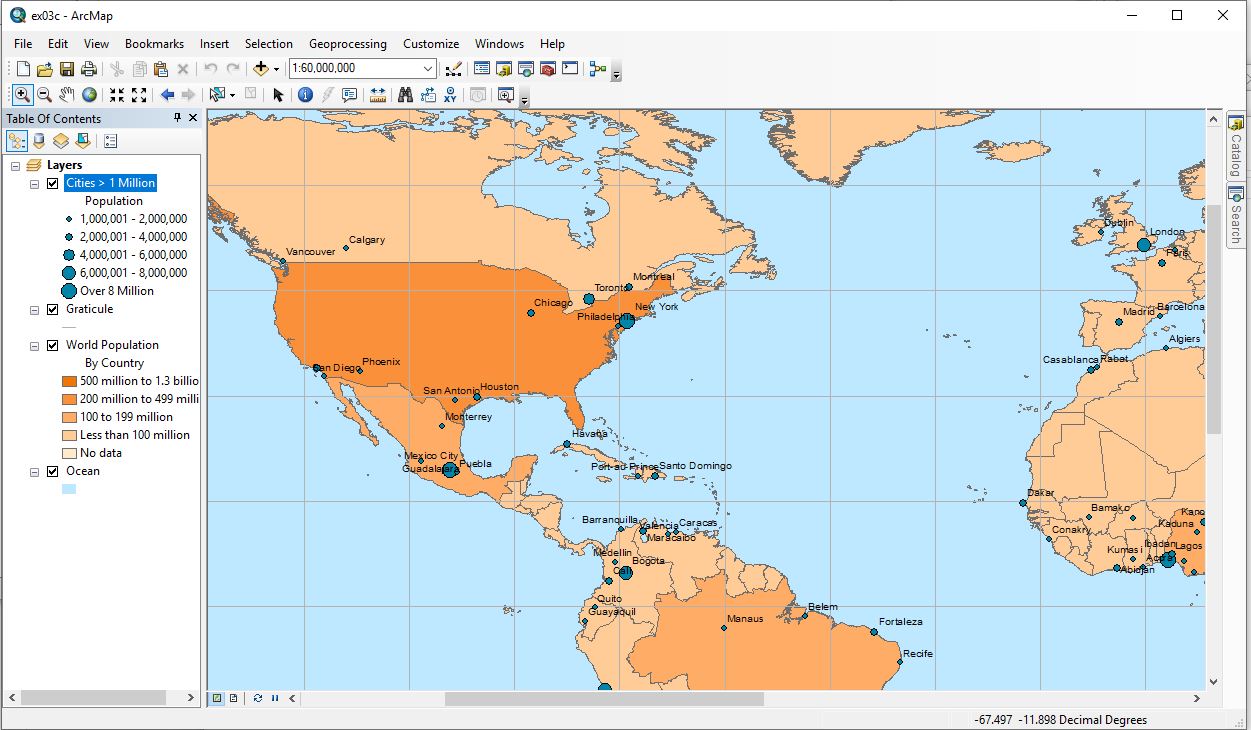
Use MapTips to quickly obtain city names.
1. Open Properties for Cities > 1 Million. Click Display tab and select “show
MapTips using display expression” check box. (Field is “Cities Name”).
2. Label Features: Open Properties of Cities > 1 Million and click Labels tab.
3. Near the top of the dialog box, select “Label features in this layer” check box.
4. Label Field is set to CITY_NAME.
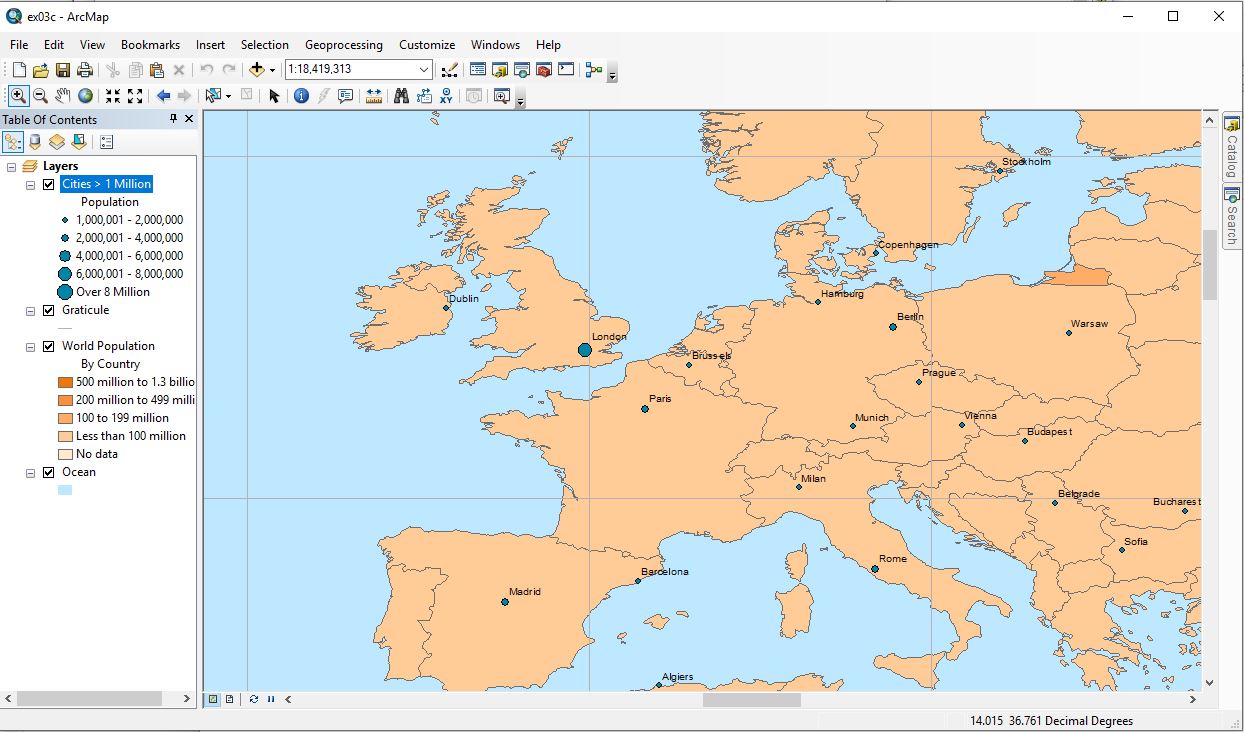
5. Click on Scale Range button.
6. In Dialog box, click the second option “Don’t show labels when zoomed”: Out
beyond 1:80,000,000. Labels will only be visible at scales larger than 1:80,000,000.
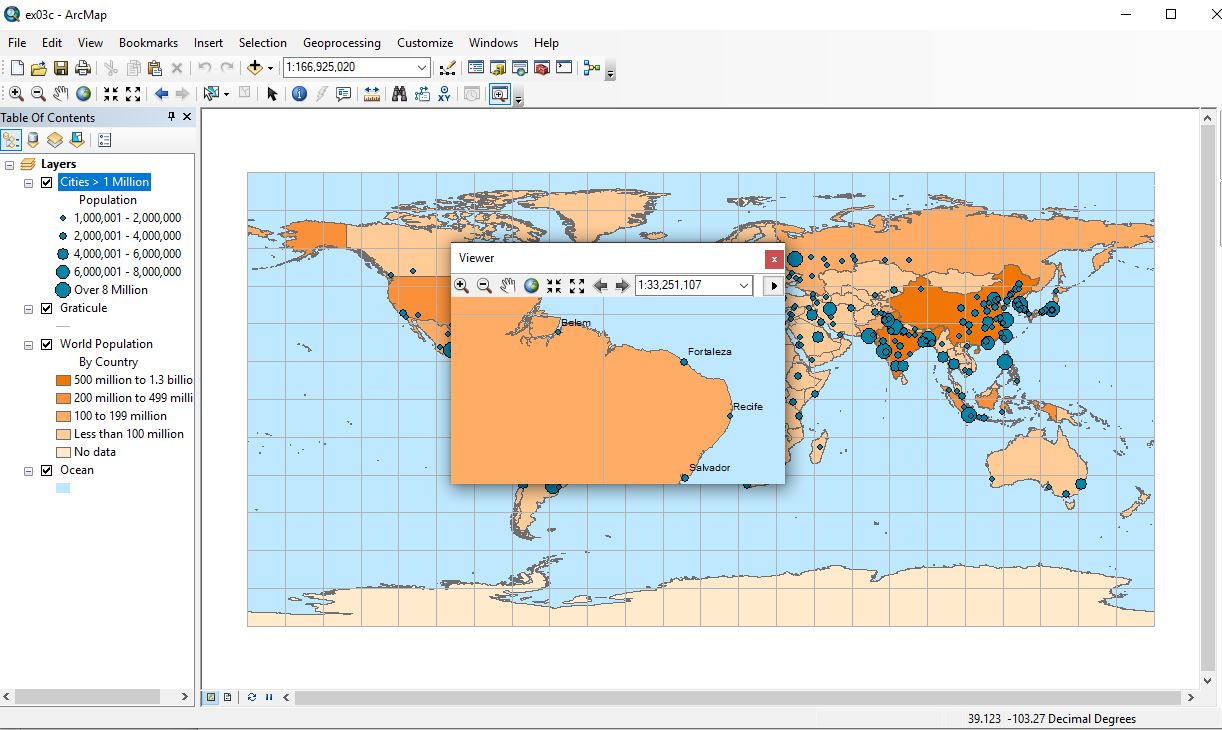
7. Zooming in on different areas by going to Tools toolbar, clicking “Create
Viewer” Window button. Press and drag the mouse pointer to draw a box
around desired area.
8. Use navigation tools in viewer window to manipulate window display.
9. Click arrow by box, check Magnifier.
10. Using Find Tool – looks like binoculars.
11. In Dialog box, in Find box type Shanghai, in the in box select
Cities > 1 Million.
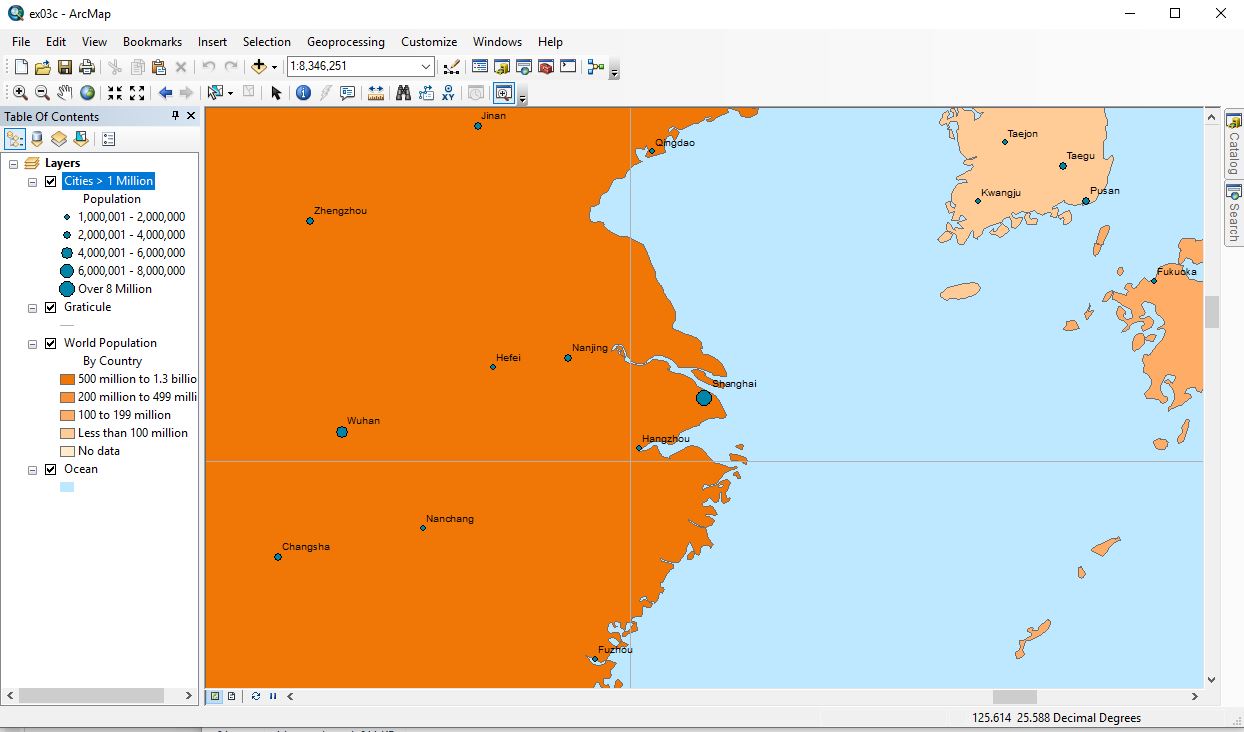
12. Click Zoom To Shanghai.
13. On menu bar, click Bookmarks > Create Bookmark. Replace name with
“Shanghai”.
14. Use Pan tool to find NYC.
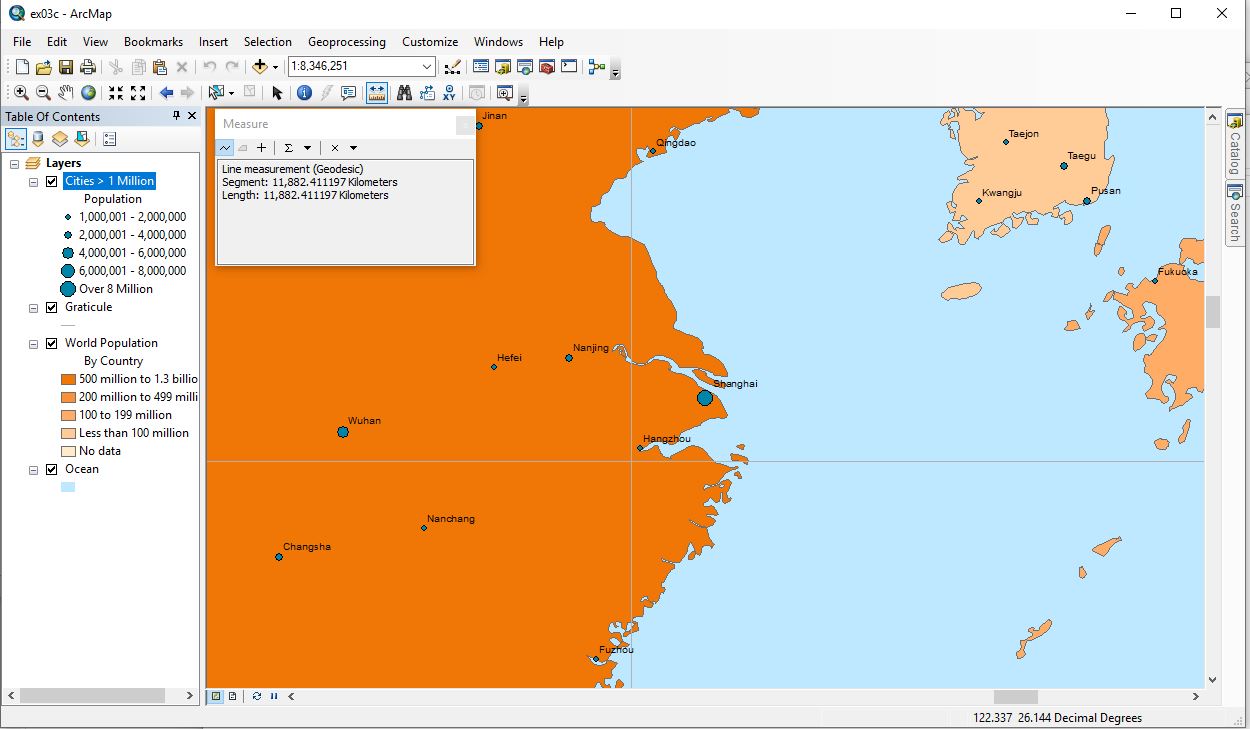
15. On toolbar click the Measure Tool, use choose units arrow to select
Distance > Km.
16. Place pointer with crosshairs at center of point representing New York City.
17. Click to begin line.
18. Go to bookmarks bar menu and click “Shanghai”.
19. Double-click the point representing Shanghai to end the measure line.
20. This tool calculates the shortest distance between two points.
Looking at Feature Attributes
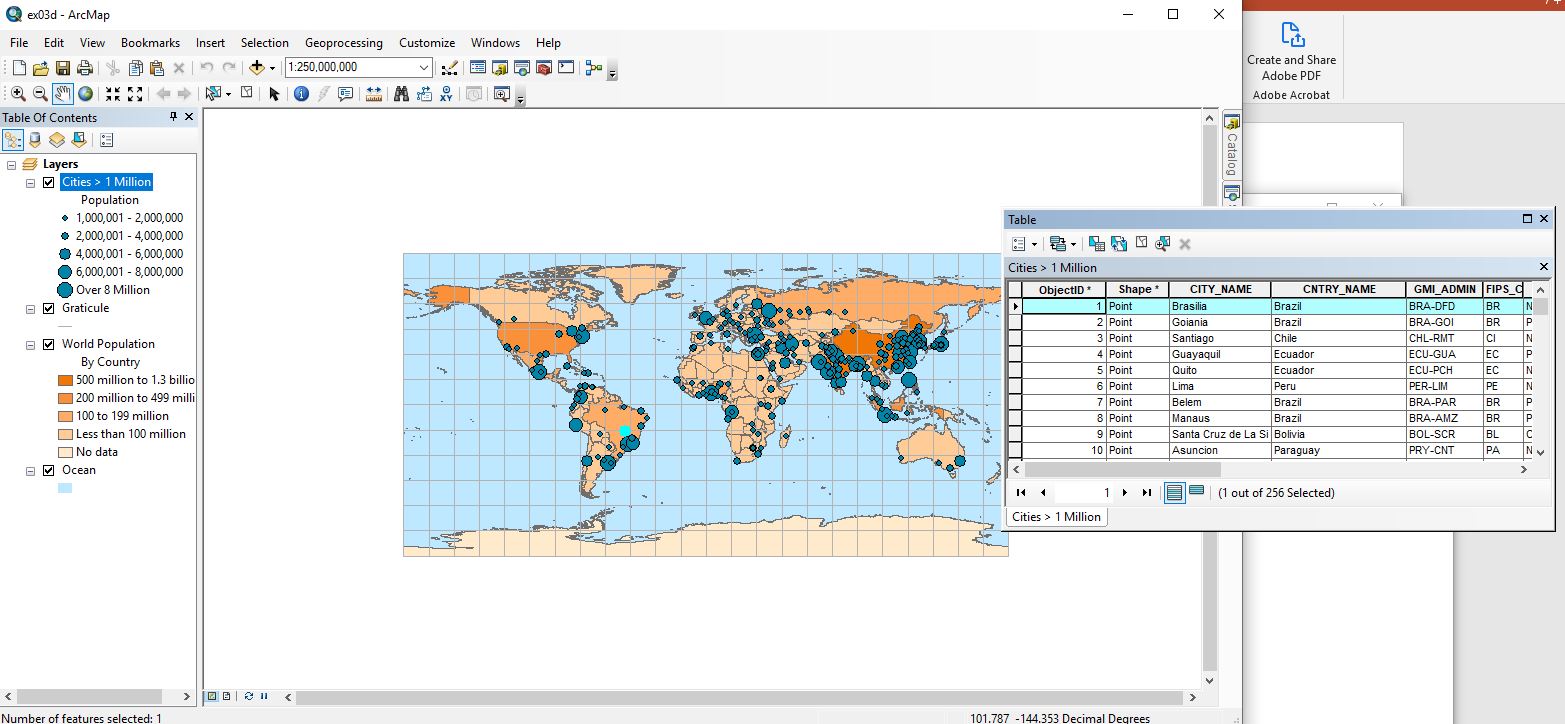
1. In Table of Contents, right-click Cities > 1 Million, and then click Open Attribute Table.
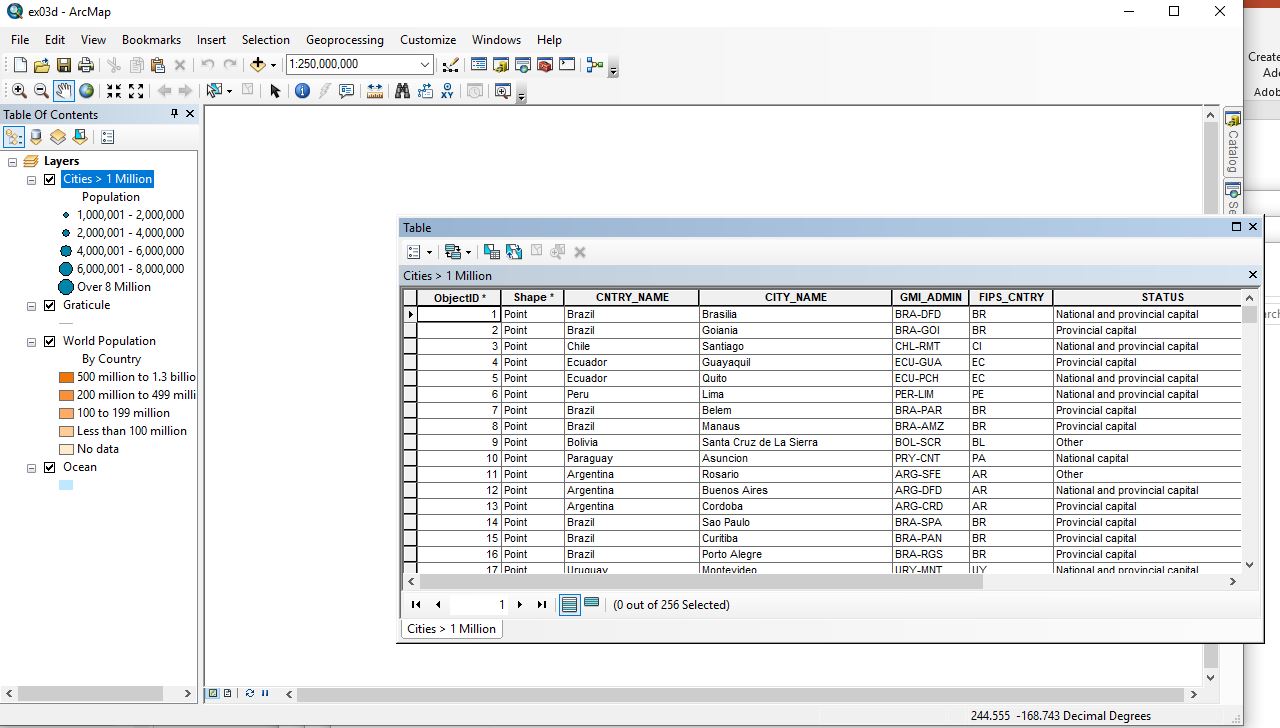
2. Resize and rearrange fields.
3. Highlight the first line; Brasilia is now highlighted on the map.
4. At the top left of the attribute table, click the Table Options arrow, and
click Clear Selection.
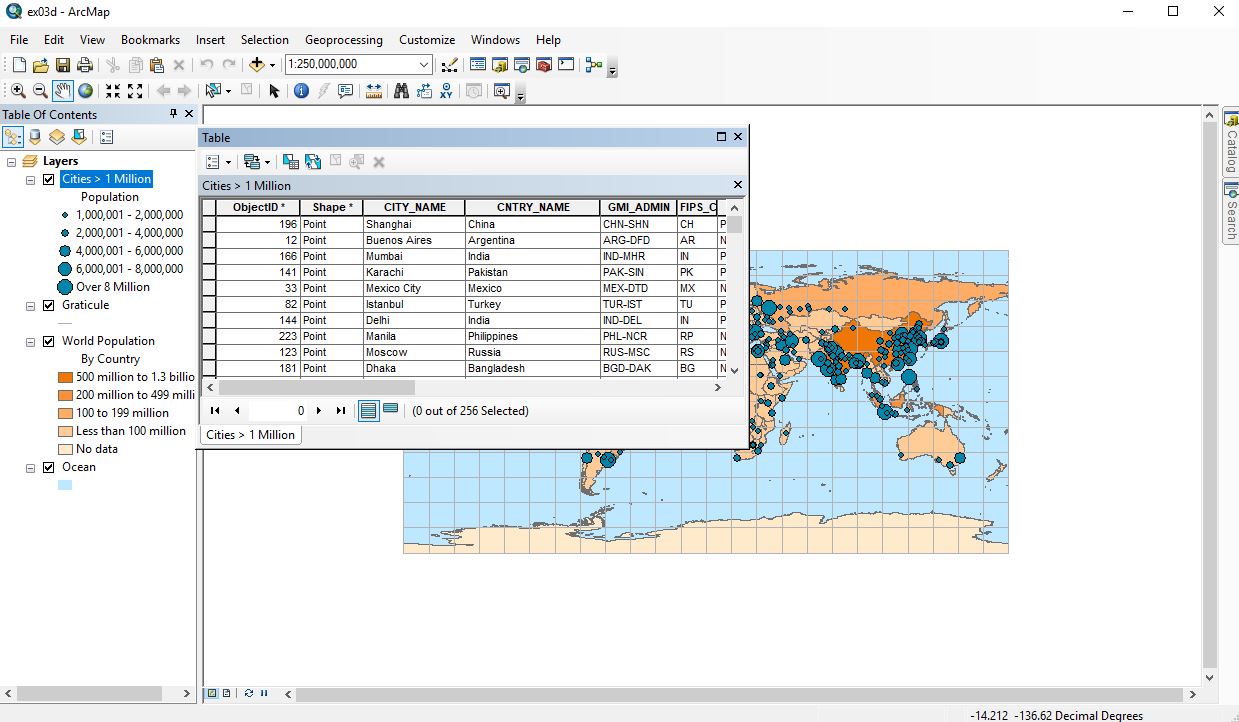
5. In the attribute table, scroll to the POP field.
6. Right-click POP, and click Sort Descending.
They are now listed from largest to smallest population.
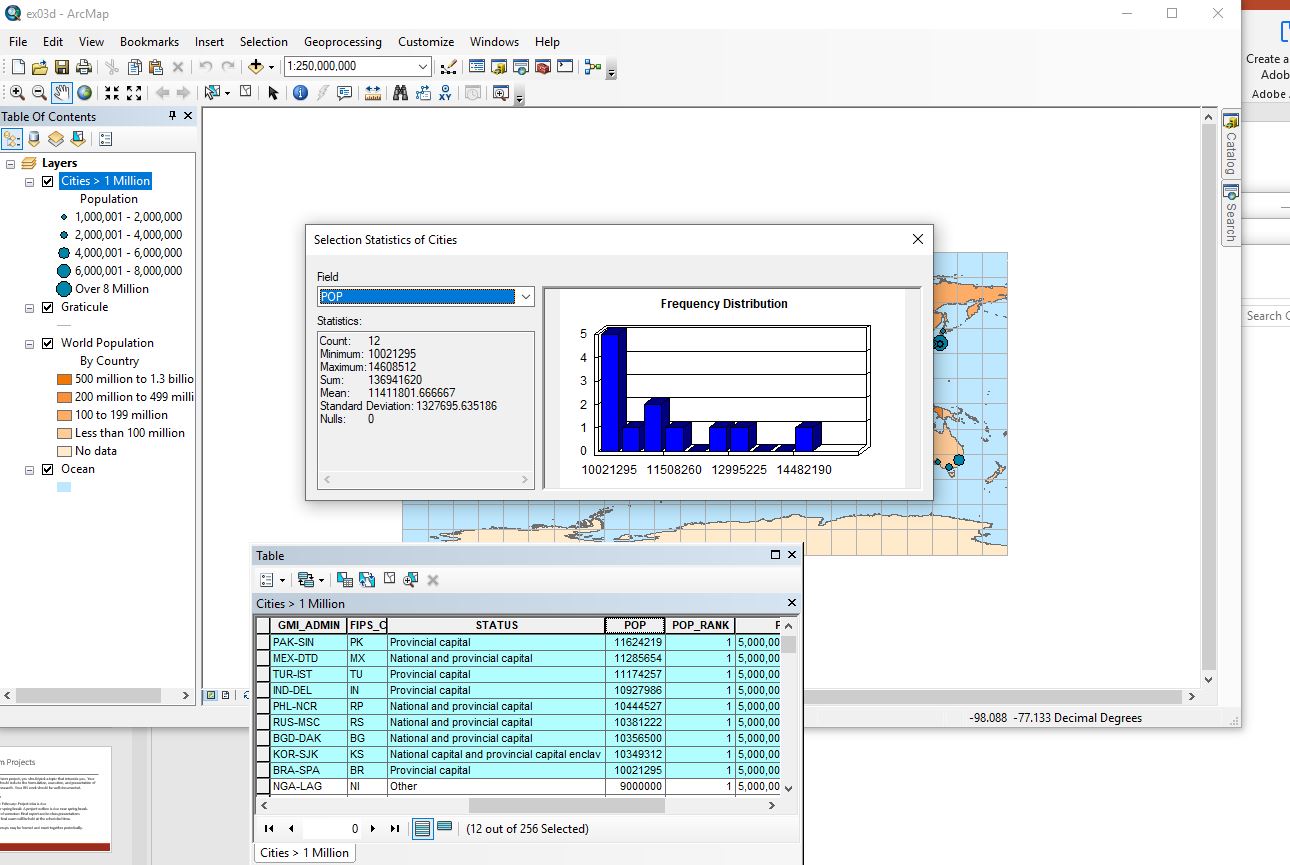
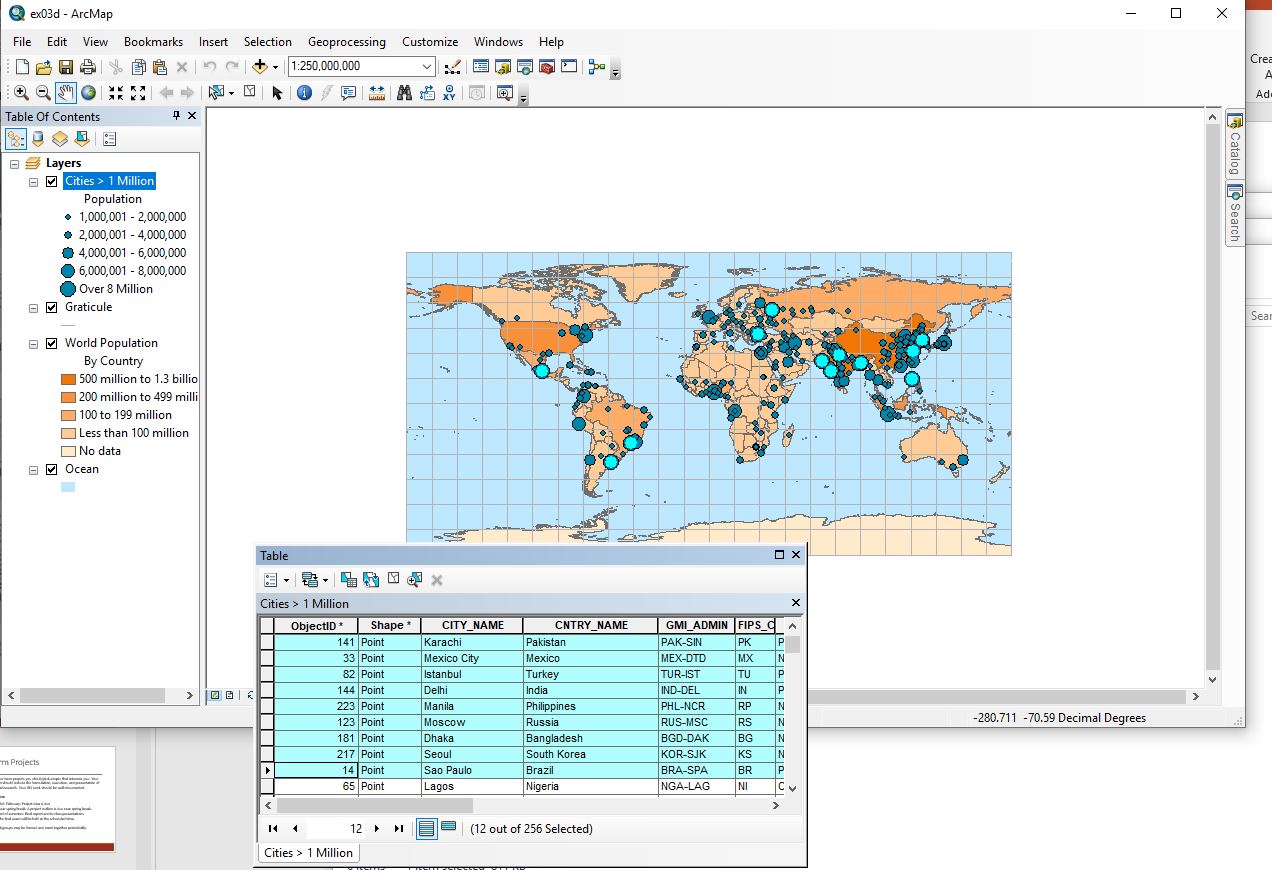
7. Select first 12 records, using shift key.
8. Those 12 records are highlighted on the map.
9. These are the 12 cities with populations of 10 Million or greater.
10. Right-click the POP field and click Statistics.
11. The Statistics include the count, min, max, sum, mean, and standard deviation.
12. The population sum is 136,941,620.