Shape
Parameters of Curves
What Produces the shape of the compound action potential?
As you have now observed, compound action potential recorded close to the stimulating electrode can be approximated pretty well by a Gaussian (i.e., “normal” or “bell-shaped”) distribution. The standard interpretation of a Gaussian distribution is that it reflects the outcome of a homogeneous process that depends on a normally-distributed parameter.
In the case of a compound action potential, the ‘parameter’ is the conduction velocity of each of the neurons that make up the nerve under study. For example, the shape of the sciatic nerve’s compound action potential suggest that a very few neurons with high conduction velocities account for the electrical activity that is represented by the initial part of the compound action potential’s curve, and a very few neurons with low conduction velocities account for the electrical activity represented by the very last part of the curve. The large-amplitude central part of the compound action potential’s ‘peak’ reflects the fact that most of the sciatic nerve’s neurons have conduction velocities that are intermediate between the two extremes, with most of the conduction velocities being concentrated near the middle of the range but fewer and fewer being represented as you ‘move’ towards the extremes.
How to Measure W1/2
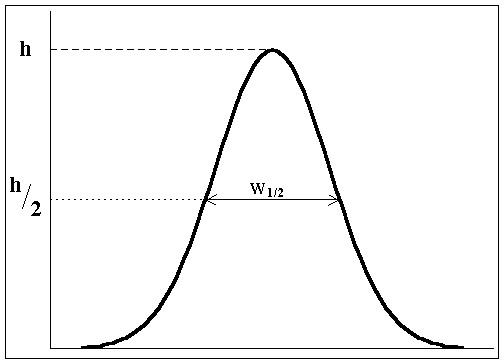
The following figure shows you how to determine W1/2 for a peak.
It’s very straightforward:
you simply determine the maximum amplitude for the peak ( = h in
the figure), calculate ½ of that value (h/2), and determine the width of
the peak at y = h/2. The units
for W1/2
are the same as the units of the x-axis; in the case of the compound action
potential, the units for W1/2 are time in ms.
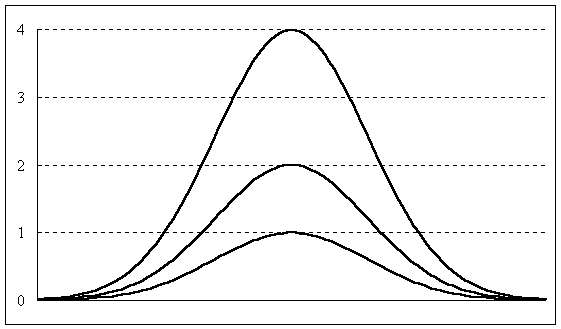
What Is The Significance of W1/2? Consider the following set of three
Gaussian distributions: The three curves all have the same mean and variance, as
would be expected if they were all based on the same underlying process. The only difference is in their maximum
amplitude, which would occur if the same process were occurring with three
different ‘intensities’. In the case of
the compound action potential, the different amplitudes could reflect, for
example, more (or fewer) similar neurons being active, better (or worse)
recording techniques, etc. Remembering that the three curves
are based on the same underlying process, you might be surprised that the
curves look quite different from one another in terms of their ‘flatness’. But, what may be a bigger surprise is that
the W1/2
values are the same for each peak (you should probably determine the W1/2 value for
each curve for practice…..and to convince yourself that they are, in fact, the
same) . The important point here is
that, in spite of appearances, the three peaks all have the same W1/2 value because
they are all produced by the same homogeneous, normally-distributed underlying
process. By extension, then, W1/2 can be a
sensitive measure of the homogeneity of the process underlying a graph of its
output. This is why you are instructed
to measure W1/2
as part of the experiments you will be conducting with the Compound Action
Potential simulation.
