Mapping the world
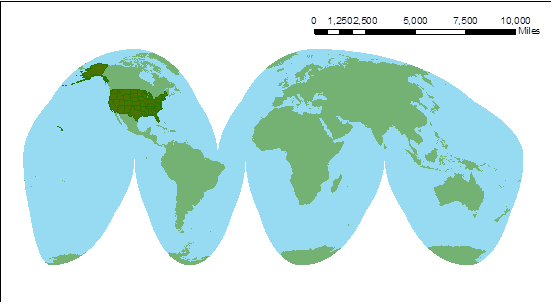 The first part of this assignment uses a map
of the world to play with projections.
The first part of this assignment uses a map
of the world to play with projections.
I chose to use the World_Goode_Homolosine_Land projection to match the
projection in the example.
Mapping the United States
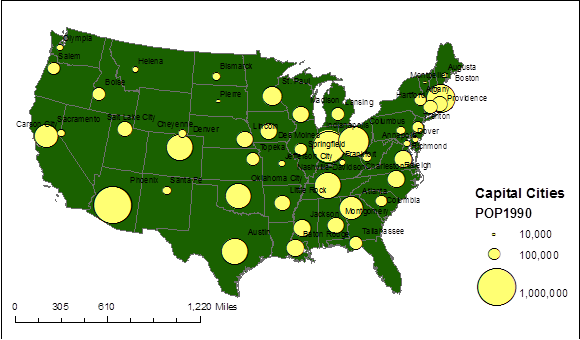
The second part of the assignment was to create a map of the lower 48 in the United stated.
Using the map I was able to determine the latitude and longitude of 3 cities, and answer the following questions;
What is the distance
between Augusta and Olympia in miles if the view is not projected?
What is the distance
between Augusta and Olympia in miles if the view is projected into Albers Equal
Area? 2547.8 miles
What are the same
distances in kilometers? 4100.3 Kilometers
Which capital city is
the most populous?
Phoenix, AZ at 983403
Which capital city is
the least populous?
Montpelier, VT at 8247
Which capital city has
the highest elevation? Santa
Fe, NM at 6989 feet
When open the attribute table, there are a lot of cities that are valued as -99 for their elevation. This is probably because
there are so many cities on the coast at sea level or just above.
Mapping New Mexico
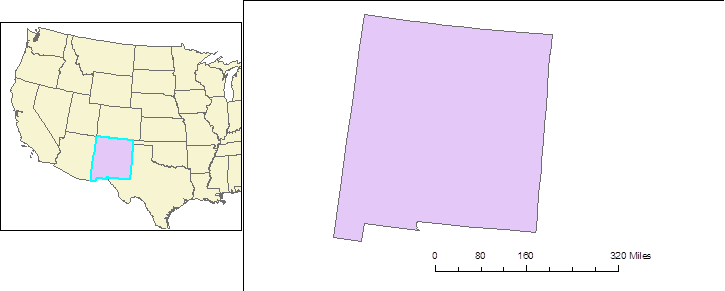 In
the third part of this assignment we created a a map
of New Mexico using the United States map we
In
the third part of this assignment we created a a map
of New Mexico using the United States map we
Created in part 2.
The first part of the assignment I used a map of the world provided. To better project a realistic view of the world I needed to change the projection. To do this I went to the data frame properties under the view tab and selected the coordinate system tab. After looking at the different tabs I found one that matched the example from the website.
First the second part of the assignment I again took a provided map of the United States and changed its projection to portray a better representation. By accessing the layer properties for the cities I was able to change the field to show just the capital cities. Under the query builder under unique values I was able to change the size of the capital symbol to be representative of the population size.
Measuring the distance between the cities asked about was pretty easy. I had to make sure that the map units were in decimal degrees and the display units were in miles. Though the symbol for the measuring tool did not show up on the website it was relatively easy to figure out which tool to click. By right clicking the layer it was easy to find the attribute table and locate the answers to many of the questions asked such as elevation.
By selected the state of New Mexico and then right clicking the layer I was able to locate the export data feature. This was the third aspect of the assignment.
Many parts of this assignment were straight forward. The directions from the website were clear and made little trouble for accomplishing the tasks.