Assignment 2
New Mexico annual evaporation
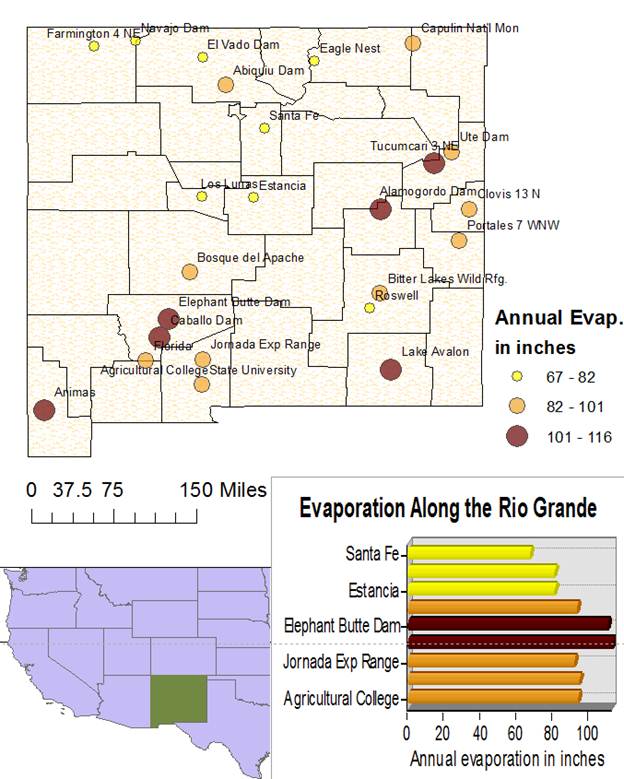
To create the New Mexico Pan Evaporation
project I first uploaded the files provided for the state of New Mexico and the
NM EVAp data.
I changed the symbols to better be visually pleasing. To focus in and simplify the data I divided
the pan evaporation data into 3 classes instead of 5. I also removed the decimal places from the
end. To create a location map I added a
second layer and included the New Mexico shape file as well as a United states shape file.
Using the directions given I
created the graph. To simplify the graph
I used only the stations near the river.
To this I selected the stations I wanted and in the second menu under
the graph options I selected use selected data. My biggest problems in doing this assignment
were figuring out how to add the location map, scale bar and index. These problems were simply solved. After a bit of trial and error and a few minutes
in the help menu I discovered to add the index and scale bar I had to be in
layout view. Once I had the scale bar on
my layout, I played around with the scale.
I tried a few things but kept getting values hundreds of times less than
what I believed to be actual. By making the scale on the layer be in
decimal degrees and the scale bar in miles, I eventually produced a scale I
believed to be accurate. To create the
location map I again used trial and error and eventually found that adding a
second layer was an easy way to accomplish this task.