
CE 547 – GIS in
Water Resources Engineering University of New
Mexico – Spring 2016 Vanessa Garayburu
Assignment 2: Given
the shape files, create a New Mexico pan evaporation map.
Exercise description:
After downloading the
UNM learn files, I opened ArcGIS, created a new map
and added all the downloaded data base using the Add Data tool. I added the
Oceans base map from the ArcGIS program and subsequently I loaded the pan
evaporation and New Mexico counties shapefiles to the work space to be shown on
top of the base map (first in the table of contents). I changed the background
color of the counties layer (no color) to allow the base map image to be
visible. I changed the way pan evaporation data was displayed. First I changed
the icons to little water drops, added a legend and rounded up the displayed
values to make it easier to read. I also added labels to all the stations
displayed and changed its font and appearance (halo) to add clarity to the map.
I switched to the Layout View, where I started to create the final view by
adding the location map. For this I loaded a light grey base map plus the world
data used in the previous homework. I zoomed in to U.S. and then I added the
County data in yellow to make New Mexico more visible. I added scales to both
maps in miles and kilometers and a north arrow. Finally I created the graph, in
my perspective this was the most challenging part, I decided to show data for
summer and winter for evaporation pans only in the dams. I exported the map to
a tiff file and saved it.
Map interpretation:
Looking at the New Mexico pan evaporation map it can be seen that the
annual evaporation (in) is higher in the southern region than in the
northern. Also areas with vegetation
density present less evaporation (Eagle nest) than lower arid regions (Elephant
Butte). To make a more detailed analysis on how the location correlates with
the evaporation, information about precipitation, elevation, vegetation, wind
and temperature would be needed.
By looking at the graph it can be said that dams with high annual
evaporation (102-117 in) like Elephant Butte and Caballo
Dam present large seasonal variations in their evaporation rate, around 6 in.
more in the summer months. On the other hand, places with low annual evaporation
(67-76) like El Vado and Ute dam, present less
seasonal variation, around 3 in. In conclusion, systems with higher evaporation
rates are more susceptible to seasonal changes and June is the month with
higher evaporation rates for almost all dams.
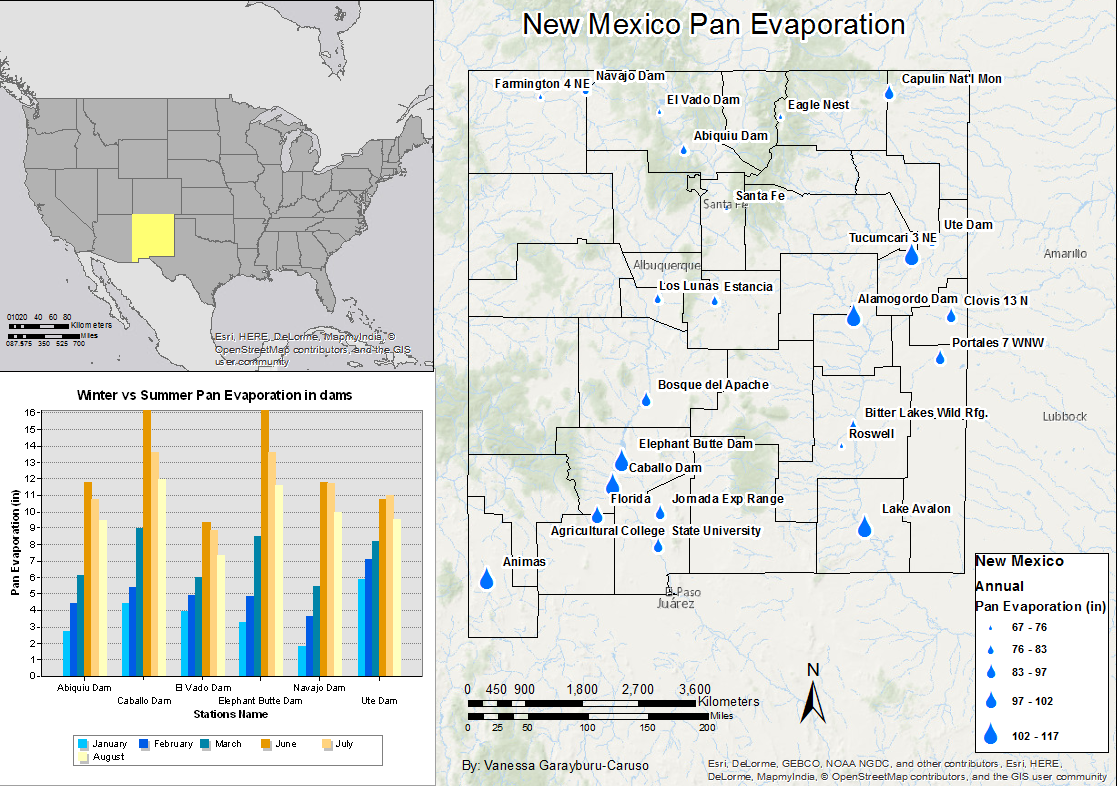
Figure 1. Shows the New Mexico annual pan evaporation in main
regions and dams.