CE 547 – GIS in
Water Resources Engineering University of New
Mexico – Spring 2016 Vanessa Garayburu
Assignment 1: Create
a simple post for your website that includes at least three figures from the
exercises you worked in Chapter 3 of Getting to Know ArcGIS.
Chapter 3: Interacting with maps
Chapter 3 of Getting to
Know ArcGIS gives an overview of the basic tools and features to navigate, display and interact with maps and its attributes.
In order to start the exercises
the user needs to make sure ArcGIS and its features is properly installed. Then
go to the ESRI website and download all the available information and files for
the exercises. Once completed these steps the open ArcMaps
and open the file ‘ex03a.mxd’. This file provides a map that includes Cities, Latlong, Countries, World Population, Air Pollution by
County, and Ocean).
Exercise 3a Displaying map data:
This first exercise is an introduction
to the concepts of layers, it teaches you about the importance of its location
on the table of contents and also about the information that can be associated
with them.
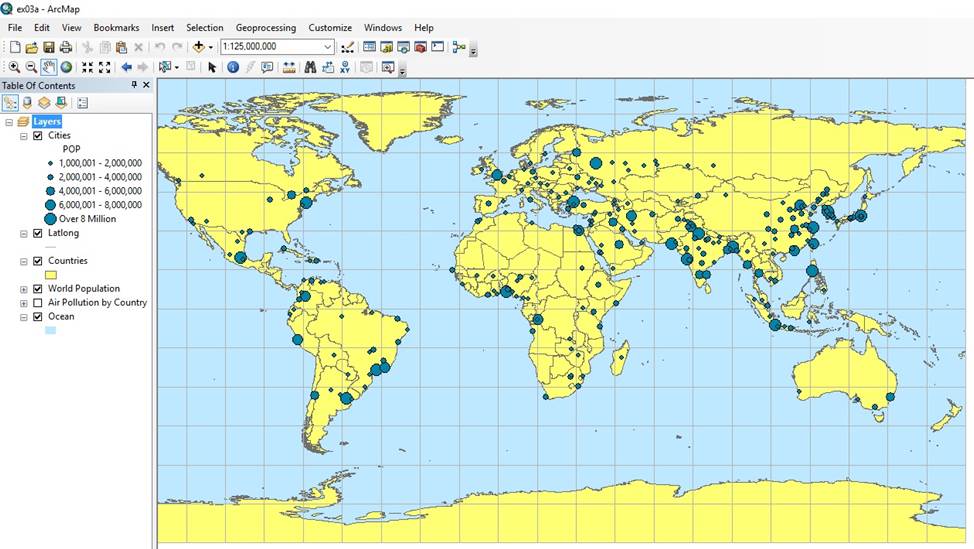
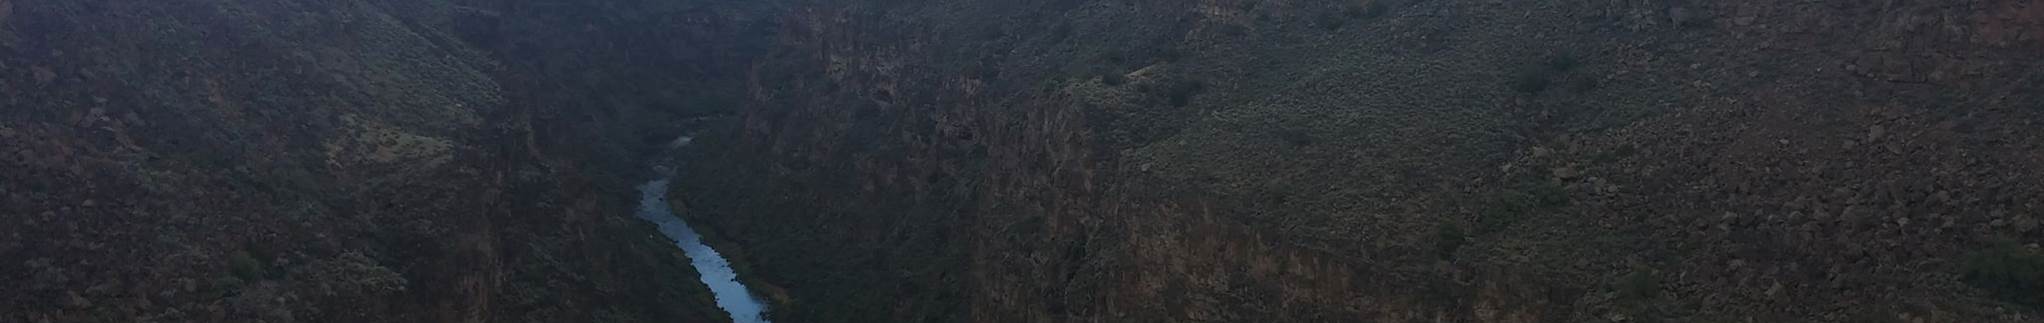
Figure 1. Shows the world map
displaying only countries despite the fact that the world population layer is
activated. This explains how the layers are superimposed.
Exercise 3b Navigating a map:
In this exercise you learn how to accurately
zoom in and out of a specific region without losing control of the displayed
picture.
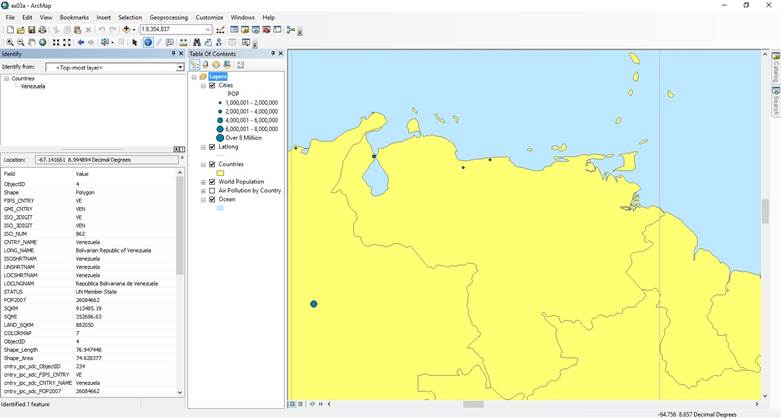
Figure 2. Shows an example of how to zoom in and
get the information of the selected country.
Exercise 3c Using basic tools:
This exercise gives you an overview of
the basic tools available to understand better maps and its qualities. It shows
you how to properly display in the image the name of the cities at a certain
scale. It also teaches you how to open a new magnifying window without affecting
the zoomed scale on the background picture. Finally it teaches you how to
calculate the shortest distance to get from one place to another (e.g. NYC to
Shanghai).
Figure 3. Shows the world map
displaying city names only for a specific scale.
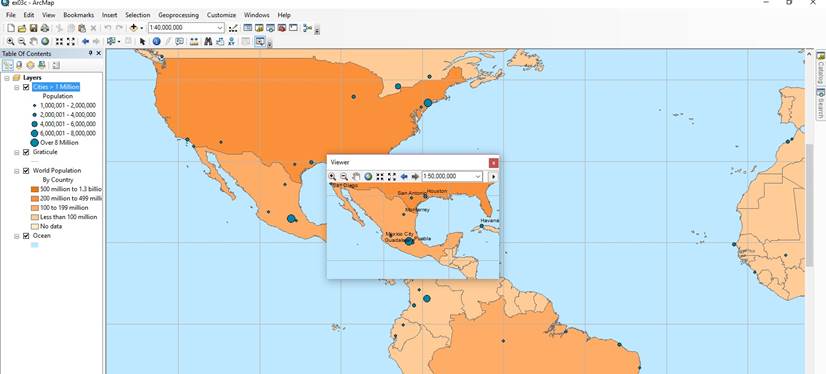
Figure 4. Shows the world map on
the background at a different scale that the viewers windows. The
background does not show the city names, the viewer’s windows
displays the name for a specific scale.
Exercise 3d Looking at feature attributes:
In this last exercise you learn how to
use the attributes table, how to read the information on it, “delete” (hide) fields
and arranging (sorting) them according to your needs.
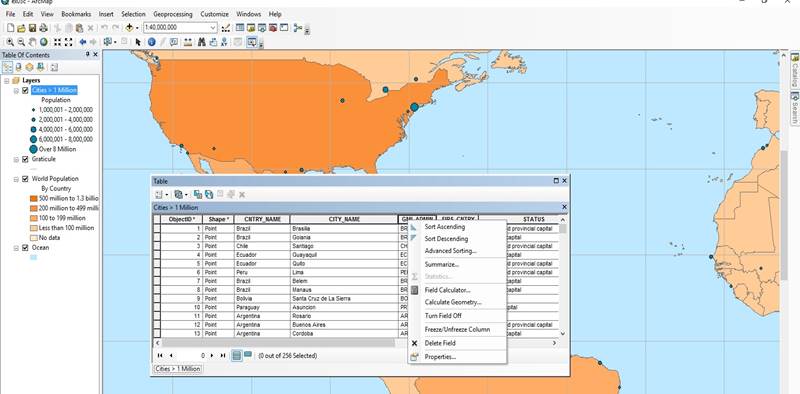
Figure 5. Shows the cities
attributes table and the options available for sorting the data displayed.