GIS UNM CE547 Spring 2006
Assignment 2
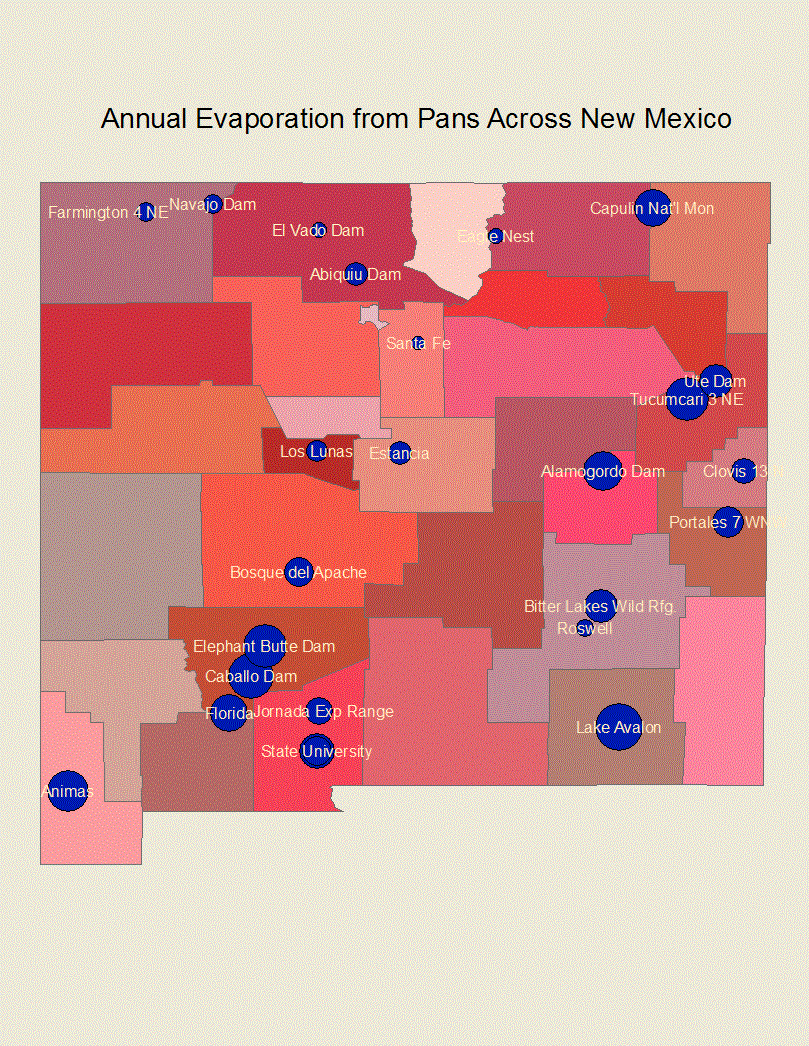
Here we are examining data from evaporation pans across the
state of New Mexico. We begin by looking at the annual sums at each
station. This gives us an overall impression of interstate variability
over long periods of time. We need the text to not be obscured by or
lost in the background or symbol colors. Yellow is commonly used in
movie subtitles. While not a particularly attractive color, yellow is
effective at drawing attention to the information that it represents.
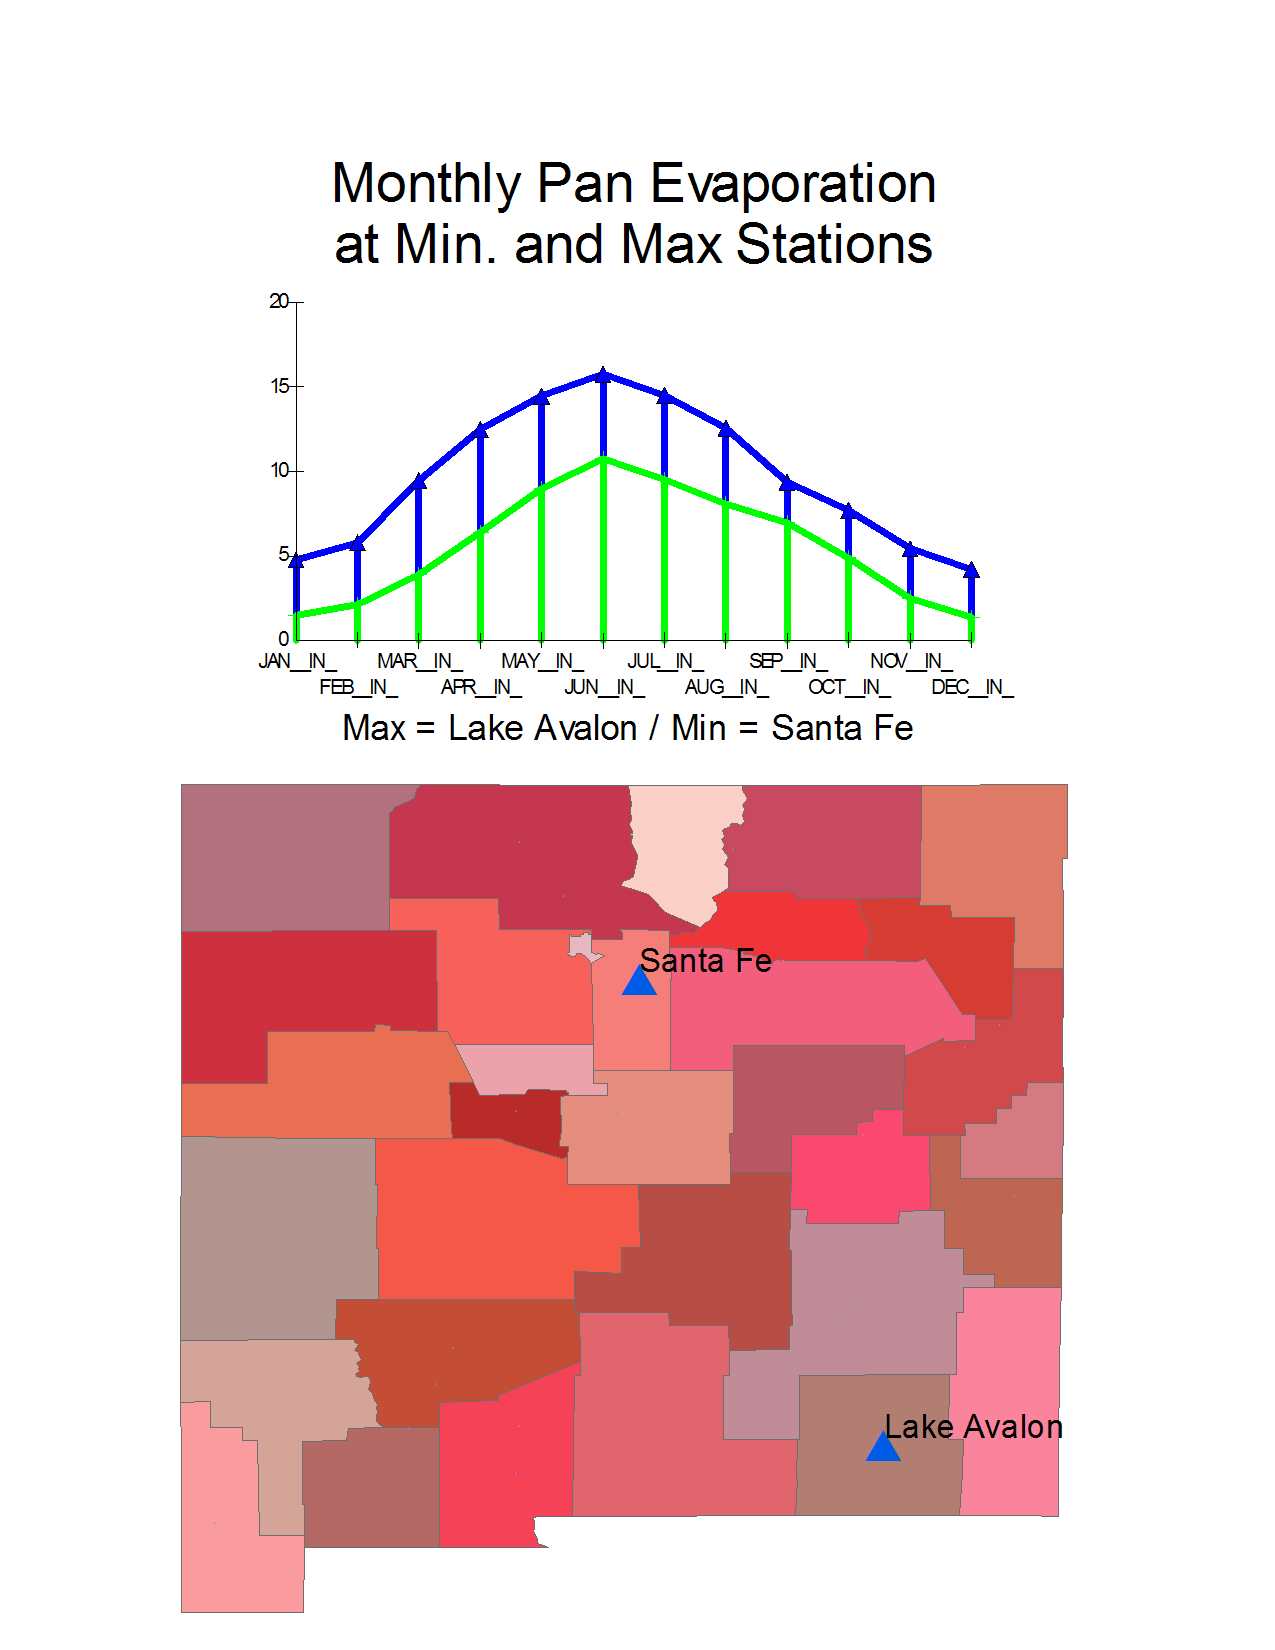
Nextly, we examine intrayear variability. By selecting the
stations with maximum and minimum annual evaporation, we can sample
differing conditions across the state. Watching these values move
across the year, we see that they follow a clear yearly periodicity,
with a minumum in the winter and a maximum in the summer. While not
entirely unexpected, the graph provides a visual impression of the
magnitude of this periodicity. Though numerical analysis would be
required to make quantitative claims, it appears here that the
difference in pan evaporation between summer and winter is greater at
Avalon Lake than it is at Santa Fe.