Effective management of wildlife habitat depends on our ability to understand and predict wildlife-habitat relationships. Habitat affects reproduction and survival in the American black bear (Ursus americanus), but knowledge of how a bear samples its environment on a local scale is limited. Most habitat studies done in North America focused on montane or mesic regions and employed such tools as radio telemetry or global positioning systems (GPS). These tools are effective on a macro-scale but fail to quantify the essence of bear movements and how they are dictated on a more localized scale.
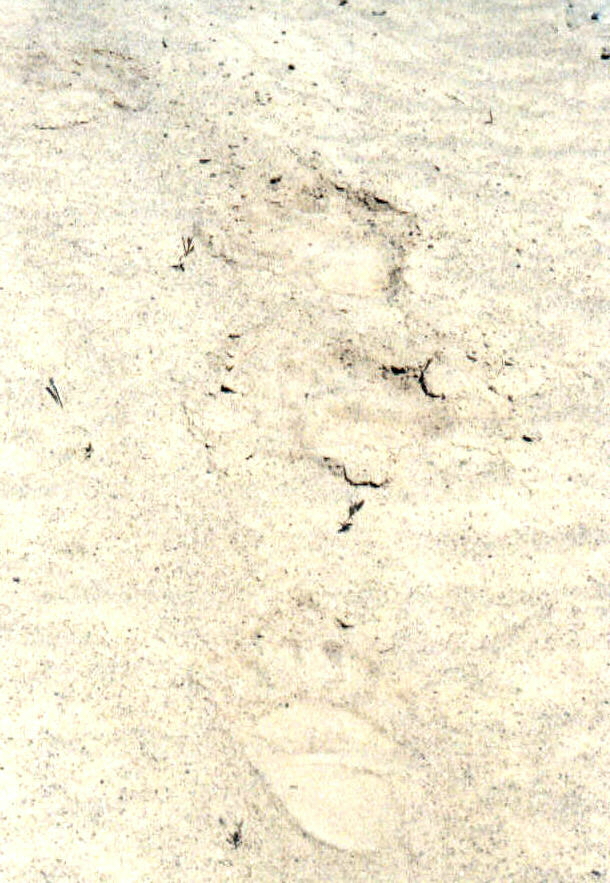
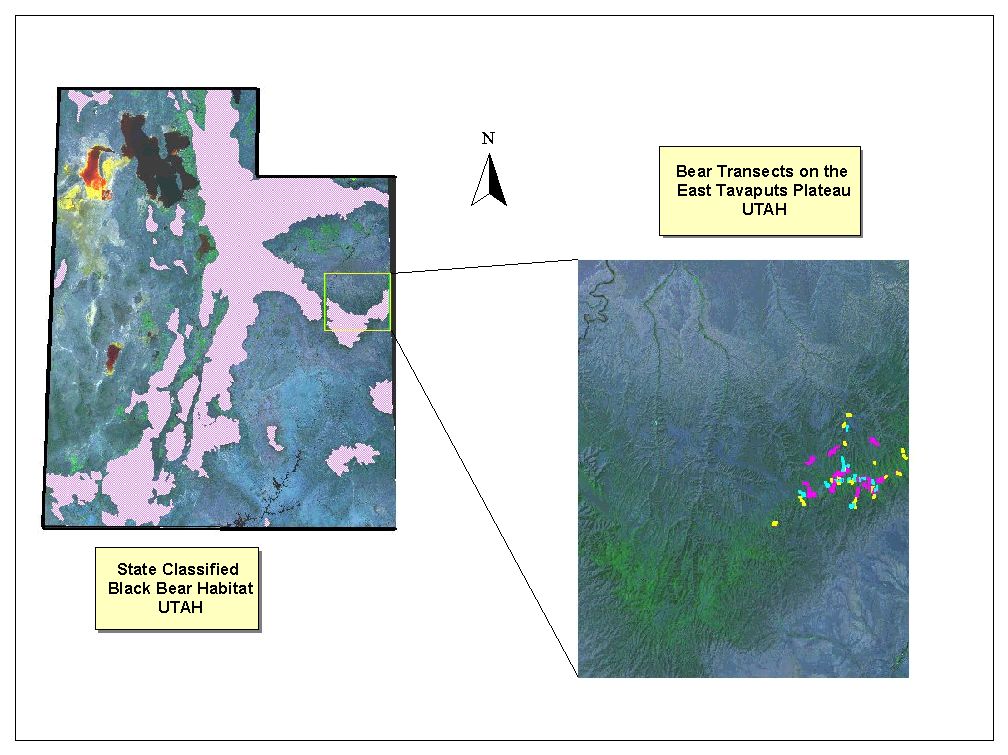
In conjunction with Dr. Hal Black (Brigham Young University, Provo, UT), the field study from which my GIS data is taken was created because we suspected that coarse conventional techniques (such as radio telemetry) do not adequately portray a bear's fine-grained use of locally abundant, high-quality resources. Over the course of three spring-early summer (early May-late July, 1995-1997) field seasons, we documented 69 bear trails (later referred to as 'transects' in my project) totaling over 80 miles of bear movements and associated behaviors.
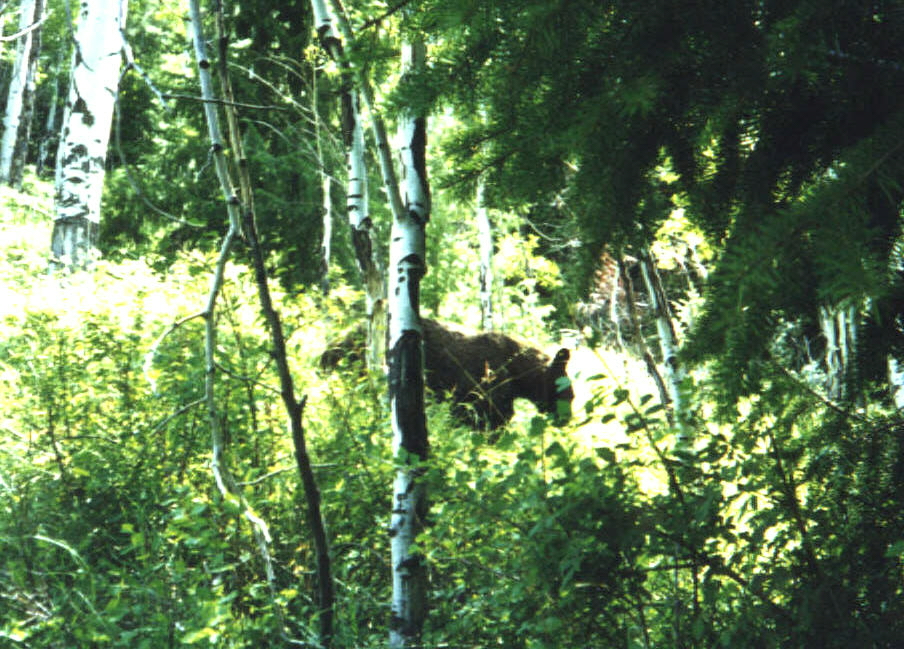
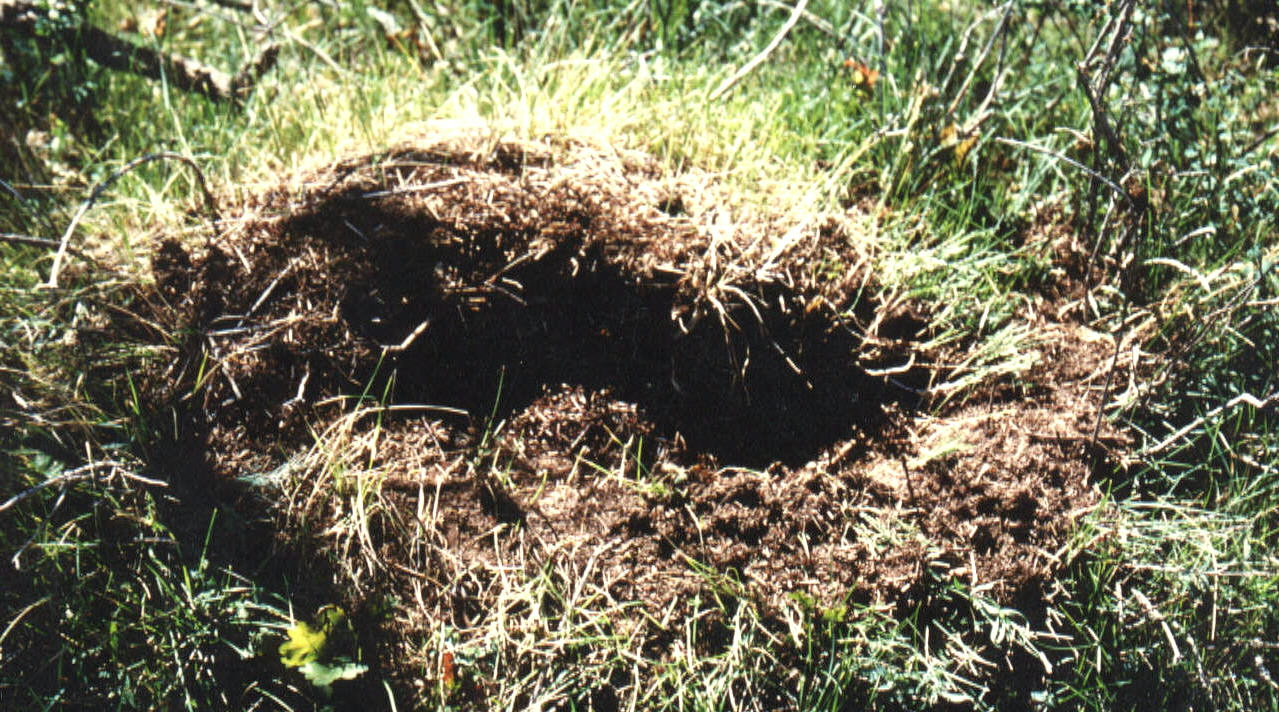
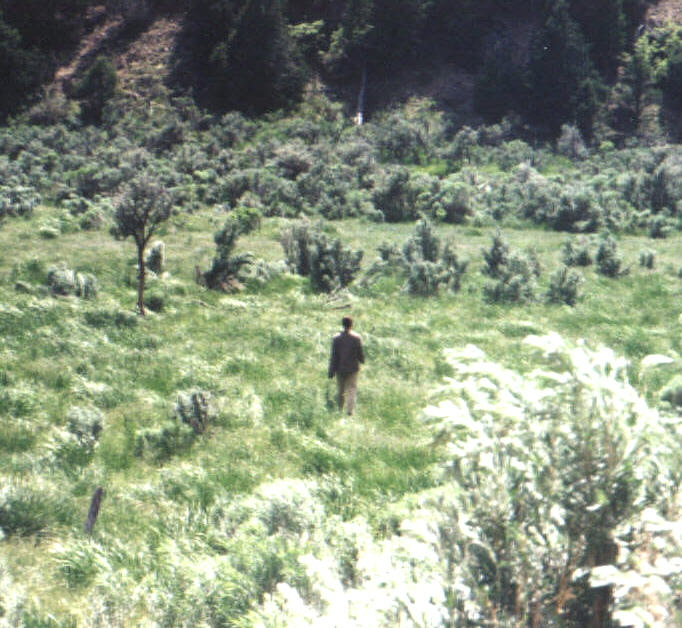
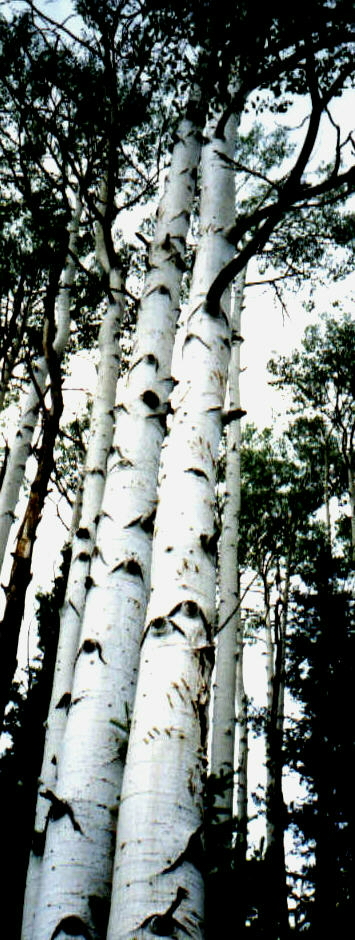
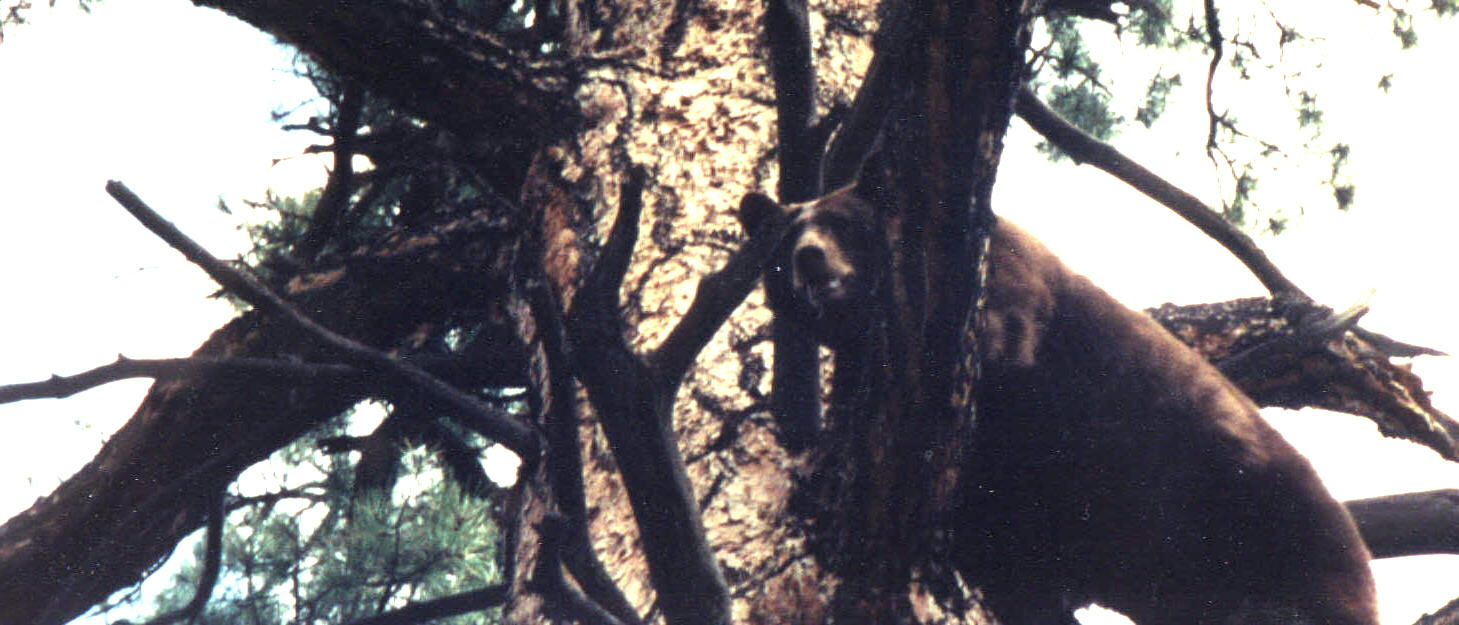
![]() Click here to view pictures of the East Tavaputs Plateau in Utah
Click here to view pictures of the East Tavaputs Plateau in Utah
![]() More details on what a black bear transect reveals about bears--a transect description
More details on what a black bear transect reveals about bears--a transect description
OBJECTIVES
MATERIALS AND METHODS
My data are projected in UTM coordinates of Zone 12, with map units in meters. UTM projections are the most commonly used system in many biological studies and they minimize area and distance distortions within same-zone regions.
![]() Click here for more details on specific methods accomplished with my data
Click here for more details on specific methods accomplished with my data
![]() Click here to see a map of elevations on the East Tavaputs Plateau
Click here to see a map of elevations on the East Tavaputs Plateau
RESULTS
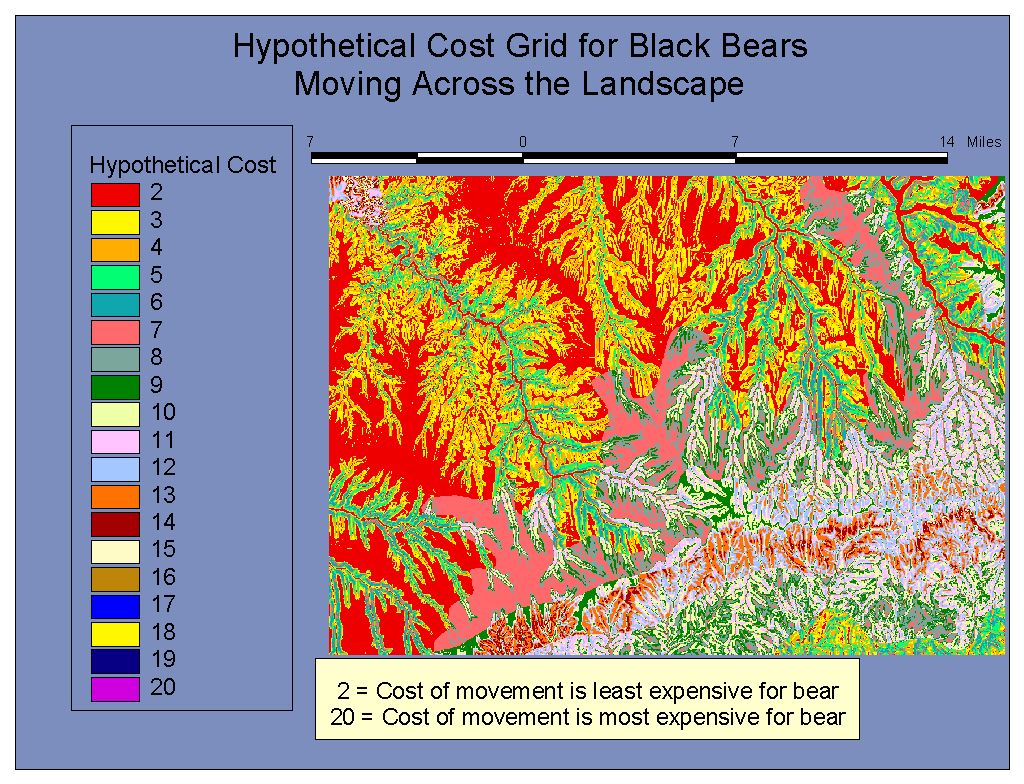
I created an hypothetical cost grid using just slope (in degrees) and vegetation density in ArcInfo®. This grid quantifies movement costs on a scale from 2-20, with two being the least 'expensive' and 20 the most 'expensive' area for bear movements. Because the vegetation data I used to create this grid is not at an adequate resolution to realistically characterize the landscape, this figure probably does not reflect actual cost to a bear moving through an area. However, it does serve to show what could be done in GIS with higher resolution data.
![]() Click here to see the hypothetical cost grid
Click here to see the hypothetical cost grid

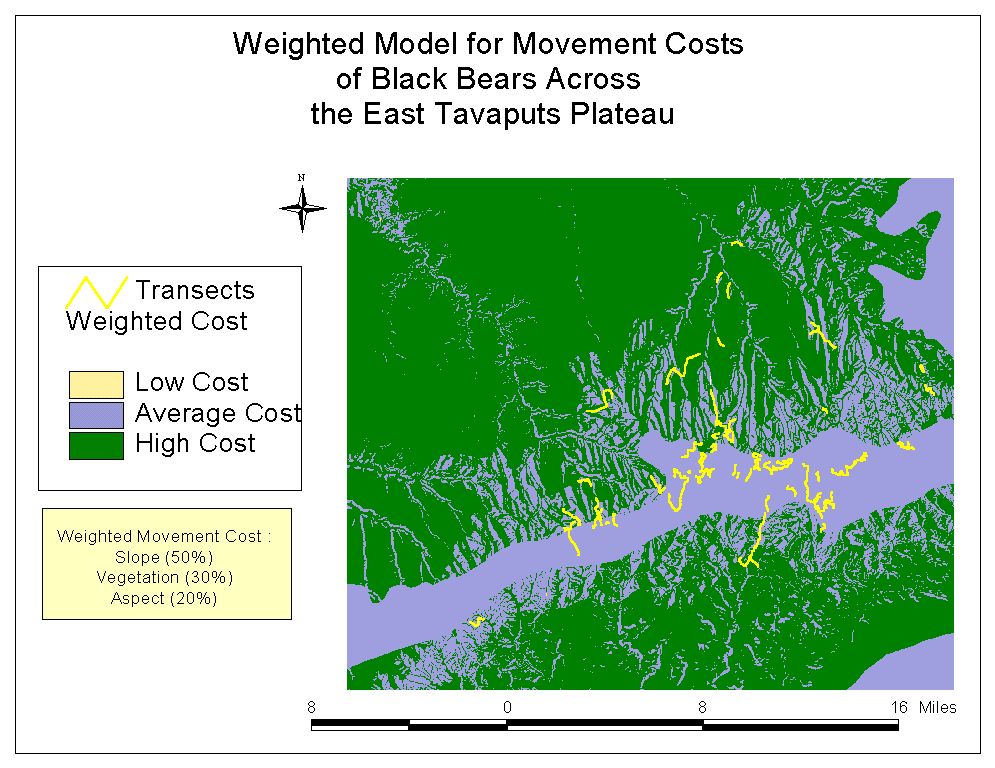
The figures to the left represent more probable solutions to quantifying costs to an animal's movements on the East Tavaputs Plateau. They were constructed as part of a larger model built with the modelbuilder extension of ArcView™. In these grids, degrees of slope and vegetation densities within habitat types were reclassified on a scale where low, open areas are most inexpensive areas for movement and steep, closed areas are most expensive.
![]() Click
here to see a graphical depiction of the model
Click
here to see a graphical depiction of the model
I reclassified
aspects with east-facing aspects being the most productive for food resources (and therefore best for bears). When I combined the reclassified slope, vegetation, and aspect grids, my model produced a grid that reveals that bear movements in this model are concentrated in a region where costs of movement are average.
![]() Click here to view my model from Modelbuilder in ArcView
Click here to view my model from Modelbuilder in ArcView
This model is a weighted model because I assumed that the variables I used differentially influence a bear's movements across the landscape, with the steepness of the slope affecting the bear's route most directly, followed by vegetation density, and finally aspect.
This model shows that bears are perhaps minimizing their costs (in energy, time, etc) by moving across areas that are of average cost because the East Tavaputs Plateau contains very little area where costs are in fact low for bear movements.
CONCLUSIONS
Perhaps because of the assumptions I made about the decisions a bear makes en route, I warn against drawing any firm conclusions about how the model depicts my data. Those assumptions would designate areas of future research from the biological perspective (such as what aspects are most productive in terms of food or cover resources or which habitats contain the most open areas), and these could then be more effectively implemented in the model constructed here. In addition, higher resolution vegetation data (from color IR or satellite images) would allow me to create more accurate descriptions of habitat types and density. With these improved coverages, I feel confident that the model could be very useful in habitat management and behavioral studies, not just for black bears, but also for other large mammals and wildlife.