ASSIGNMENT #1
Explanation
The exercises allowed me to familiarize myself with
ArcMap, since I have never had any experience with GIS. The first assignment
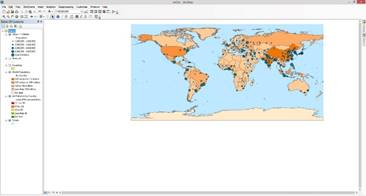
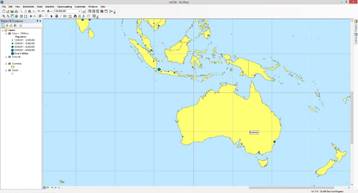
dealt with “Interacting with Maps” in Chapter 3. Exercise 3a I was able to
display map data. The document I interacted had world data that taught me the
basics of map documents. I was able to access the document and then played
around with the different layers that were included within this data set.
Within the table of contents you are able to turn any type of layers on and off
that are displayed on the map. This exercise allowed me to see how there exists
a layering system and how to move layers around so once can be visible and/or
the other layers turn on and off. Also in this exercise I accessed the layer
properties that would allow me to change the layer name that makes more sense
to the data collected. Within this exercise I learned how to use the “identify”
button that will show you the field as well as value for each country that you
are identifying.
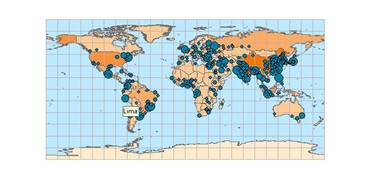
In exercise 3b I learned how to navigate a map. This
tool is essential when you want to move across a map or zoom in and out of a
map. This tool is also practical when you want to identify a country if you are
not sure what that country is.
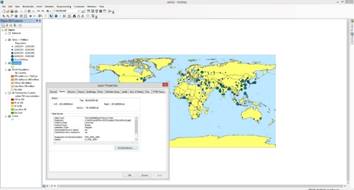
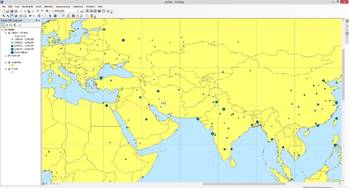
In exercise 3c I learned the basic tools of ArcMap.
For example you can turn on and off cities to where there are visible or not
visible with the data set, which is assessable within the layer properties box.
Another useful tool is the find box, where you are able to type any city and
ArcMap will directly take you to that city you are searching for within the
data system. You can also decide whether you want to pan to this city, zoom or
even add to “your places”. You can also create a “bookmark” that enables you to
go back to a past area or data point. With bookmarking a point you can go back
to that point and say measure its distance from one city to the next. In this
exercise I measured the distance from Shanghai to New York City which is
approximately 11,000 kilometers. This was used with the measuring tool.
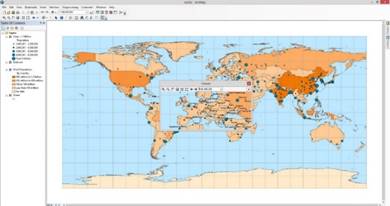
In exercise 3d I learned how to use the attributes
table. Within this attribute table I was able to choose the data I wanted to
view and it displays the cities selected directly on the map. Because there are
so many datapoints displayed on the map I can select through the attribute
table which cities I want highlighted on the map. The attribute table seems
like a pratical tool to see and organize your data and see it visually
displayed on the map.
Assignment
#1 Assignment
#2 Assignment
#3
Assignment
#4 Assignment
#5 Assignment #6