develop your own website

Electronic Effects

Our work for the Center of Excellence on the Science of Electronics in Extreme Electromagnetic Environments is focused on carrying out 
qualitative/quantitative understanding of microcontroller instructions and their effect on port impedance.  The overall project involves using the Random Coupling Model as a foundation for developing a black box predictive effects model  

Microcontroller’s Port Impedance and Emissions Dependence on Instruction Set 

Black Box Model

Introduction:
The overarching goal of this project is to develop a black box behavioral model for electronic effects due to EM interference. A fully developed behavior based model can aid in the development of a predictive capability of the effects of side channel attacks on electronic circuits. The theoretical underpinnings of this predictive behavior are based on the random coupling theory.

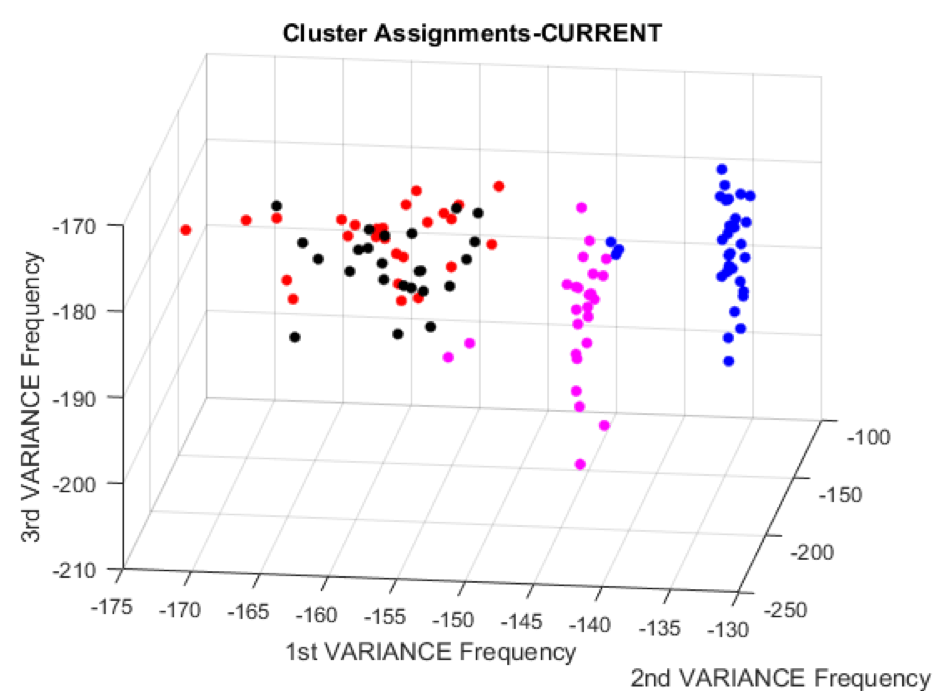
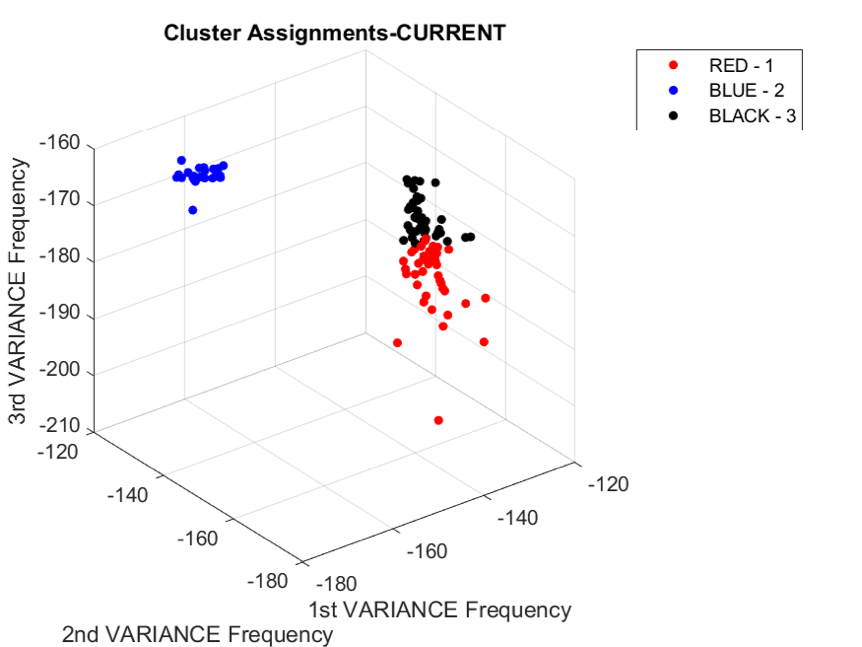
Instruction Dependent Port Impedance

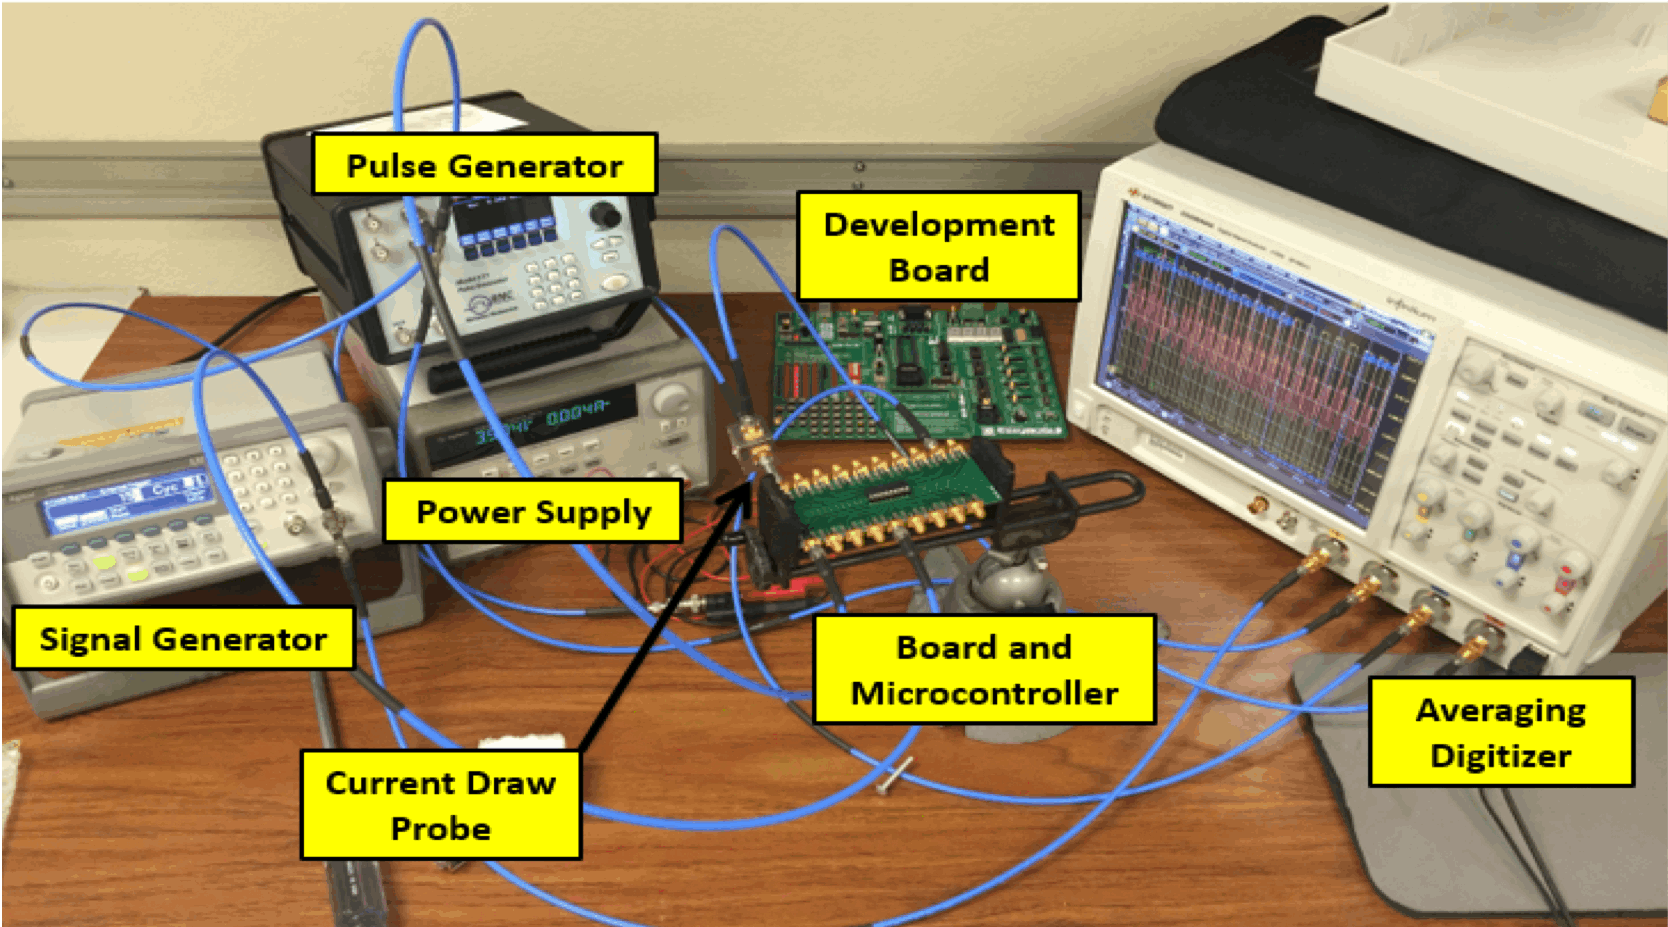
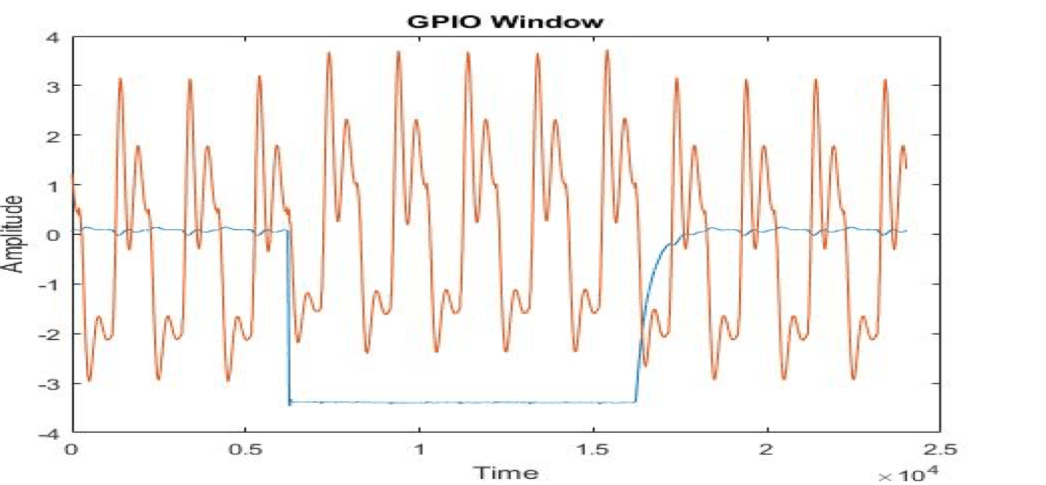
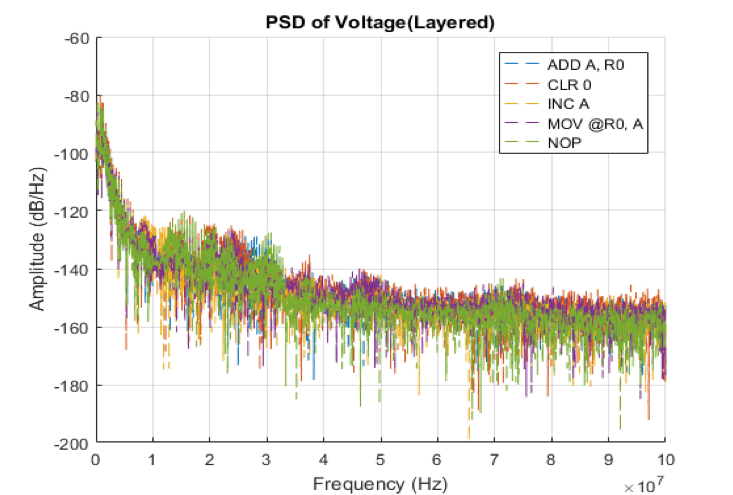
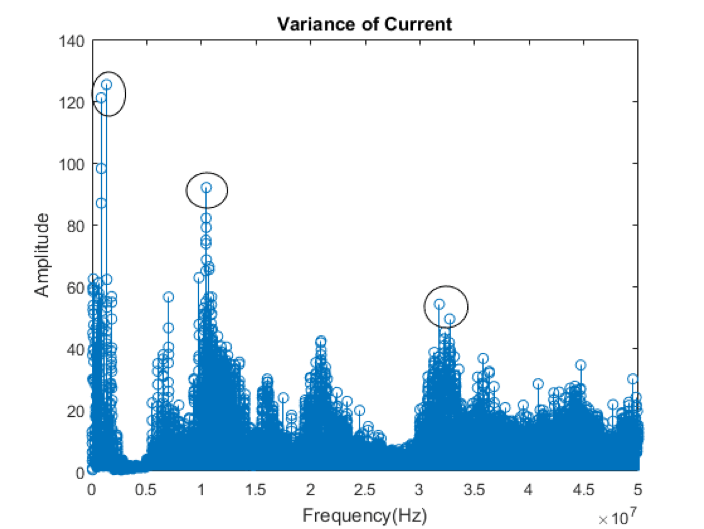
As part of this project our goal is to measure and classify voltage, current, and EM emissions of an 8 bit microcontroller operating under different instructions. Fluctuations which are dependent on instruction will be measured which will reveal distinct patterns in microcontroller behavior.

Mobirise
Mobirise

GPIO Window -identifies ROI

The output pin is pulled low and high. This creates a GPIO window for easy recognition of target instruction when we gather data and do our data reduction

Mobirise

Fourier Space Analysis

The resulting data in the time domain is difficult to analyze for the small variations in side channel information as a function of instruction. In order to overcome this we transform the data to Fourier space which allows us to find the highest variance. 

Mobirise

Variance and 'P' Values

The variance for all instruction sets is calculated, resulting in a single variance plot with respect to the frequency. This represents the largest difference in the values at specific frequencies. The first three maximum variance values and their corresponding frequencies are selected and are called the "p" values. 

Mobirise

Vector Quantization Analysis

The resulting 3D variance table with respect to instruction set is then analyzed using a vector quantization method. This cluster analysis is carried out using the Kmeans algorithm to group instructions with like variances. Figure 4 shows the resulting cloud scatter plot. 

Initial Conclusions and Future Work

Clustering results show a distinct variation of the current, in this example, with respect to instruction. In figure 4 the blue dots represent branching instructions such as ACALL, JB, JC, which indicate that there are pathways within the chip leading to similar electrical behavior. The red black clusters is comprised mostly of arithmetic operations, while the magenta cluster is comprised of instructions that use the accumulator within the chip. Similar constellations have been observe with voltage and EM emissions.

K-Means Clustering

Its Fast! Simply computing distance between points.  However, the number of clusters must be defined a priori and the algorithm is dependent on the initial centroid locations 

Mobirise

Combine PCS + Kmeans

We can overcomethe 'drawback' of the K means analysis by carrying out PCA first to determine the numberof clusters (which clusters cover 80-90% of the variance).  Then carrying out a K means analysis to do the cluster classification. Results are shown in this image.