


Special Note: This is an older web page that describes work that was prepared before recent upgrades to ArcGIS Online. Esri has retired its older web mapping applications because they are built on the legacy ArcGIS API for JavaScript 3.x. Some of the web maps on this page may need to be replaced as they could have used this older web mapping application. I am not planning to replace these older web maps. However, this web page will remain accessible as it describes earlier research that could be updated in the future.
My master's thesis research was concerned with the location of food stores in Albuquerque, New Mexico. Although completed during 1982 using now antiquated computer mapping software (ESRI's AUTOMAP), the focus on developing a model of retail coverage is still relevant. Back then, the combination of AUTOMAP and the Statistical Analysis System( SAS) software provided a capable GIS platform to conduct this early research. Currently, the more modern facilities provided by ArcGIS for Desktop are being used.
There is a long history of research related to store location analysis within the business community and also within the academic social sciences. Much of this research has focused on the delineation of trade or market areas to assist in choosing potentially profitable locations for new stores. Recent research has been more concerned with "identifying areas where healthy and affordable food is difficult to obtain". An underlying process related to most of this research is geographic (spatial) accessibility. The following are some links to background information and previous research on these topics.
Geographic Access to Food Stores
-
Selected Links and Publications:
- Business Site Selection, Location Analysis, and GIS
- Retail Location
- Retail Planning & Central Place
- Access to Food
- Healthy Food Financing Initiative
- USDA News Release - Online Tool for Locating "Food Deserts"
- Food Desert Locator
-
 Albuquerque Food Stores - Retail Coverage & Market Equilibrium
My current research will focus on 2010 Albuquerque, NM food store locations. It will develop an updated model of retail coverage similar to the model used in my thesis research. It will also explore recent measures of food deserts and compare them to my model of retail coverage. A series of ArcGIS Python scripts will be developed to operationalize the measure of retail coverage and selected recent measures used to define food deserts. These scripts will be made publicly available for other researchers to use.
Recent Developments
As this research progresses I will be posting preliminary results and final presentations and publications as they are developed. Some of these results will be available on ArcGIS Online in several GIS formats (interactive web maps, map package, map services, map layers, and shapefiles). I will also make selected map PDFs available once they have been prepared. Note: This work was recently updated as a class project for the spring 2014 semester. A poster and presentation are available below that describes this work that was done mostly using ArcGIS ModelBuilder and Ordinary Least Squares Regression ( OLS)). Future updates are planned that will explore the use of Geographically Weighted Regression ( GWR) that could improve the results of this analysis. In addition, I still hope to use the SAS Bridge in combination with ArcGIS ModelBuilder and Python scripts (add-ins).
New: My earlier development of an ArcGIS ModelBuilder application and Python script tool derived from ModelBuilder proved too cumbersome and slow although it worked well. I have started developing a mostly Python script for ArcGIS(ArcPy) and also a R function for this retail gravity model. I have also begun developing a QGIS plugin based on these scripts that will be made available for public use (see the QGIS Plugin Repository). As both ArcGIS (R-ArcGIS) and QGIS (external application) have developed improved interfaces for R, now is a good time to do some more development with this widely used open source statistical software. It should be interesting to compare the results from Geographically Weighted Regression using both the ESRI (GWR) and the R (spgwr ) versions. These updates were conducted as a project for the geography classes I had this fall (2015), there is a powerpoint presentation below that describes this work and the results. ( Updates: I have also begun exploring the infogroup data recently obtained by the NM Department of Information Technology and provided by the NM Community Data Collaborative as a source for more up-to-date retail data for use with the gravity model - the database contains several stores that have already been closed by 2013 and still needs edits, however see below for initial map examples before the database has been revised. I will be using Esri Demographics as the source for population data estimates at the census tract and most importantly the block group levels due to accuracy and availability concerns. I still need to finish the Python script for ArcGIS(ArcPy) and will use the infogroup 2013 store size, sales volume, and number of employees data - these results and documentation will also be available below when completed.)
Also Note: If you have problems viewing these PDFs try another PDF reader other than Adobe Reader. See Foxit Reader that should work better on a downloaded PDF. This should allow the text boxes on the poster to display properly.
Other Research
I recently became aware of excellent research being conducted by Esri (see Measure and Map Access to Grocery Stores) that exemplifies some of the latest GIS based methodologies. I will try to update my research with some of these features and current data in the future.
Current Results (ArcGIS Online Web Map)
(see Web Mapping Applications below for a better display)
Preliminary Maps and Presentations:
-
Albuquerque Food Store Location Analysis, 2010 (OLS version)
-
Albuquerque Food Store Location Analysis, 2010 (GWR preliminary version)
-
Albuquerque Food Store Location Analysis, 2010 (poster, OLS version)
-
 Albuquerque Food Store Location Analysis, 2010 (presentation, OLS version)
 -
Albuquerque Food Store Location Analysis, 2010 (ArcGIS ModelBuilder, OLS version)
-
Albuquerque Food Store Location Analysis, 2010 (presentation, R OLS & GWR version)

-
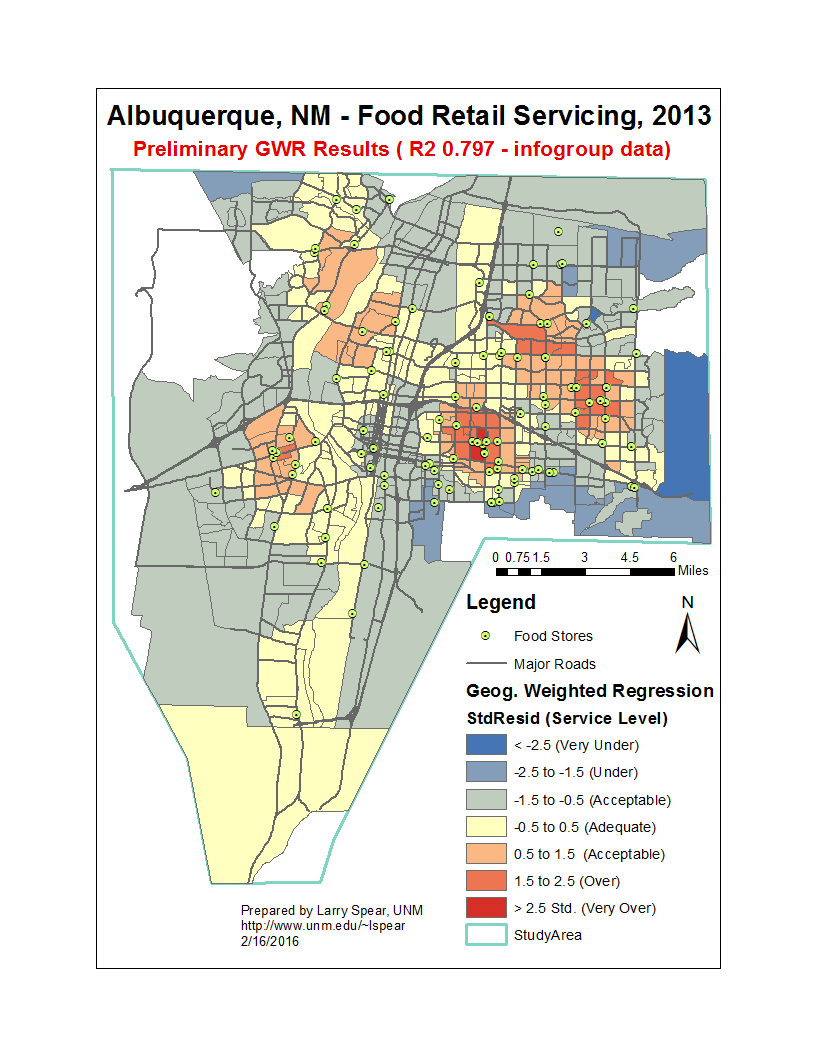
Albuquerque Food Retail Servicing (Gravity Model & GWR), 2013
Web Mapping Applications:
Albuquerque Food Stores, 2013
An ArcGIS Online Web Map Viewer or ArcGIS Online Web Map Application are available.
Address and Contact Information
     Larry Spear, Sr. Research Scientist (Ret.)
     Division of Government Research
     University of New Mexico

     Home Phone: (505) 260-1810
     Email: lspear@unm.edu  lspearnm@gmail.com
     WWW: https://www.unm.edu/~lspear
     LinkedIn https://www.linkedin.com/in/larry-spear-93371970
 UNM's Home Page
This page has been accessed 16998 times since 7/13/2012.
You are the 16999th person to access this page.
Last Revised: 8/24/2021 Larry Spear (lspear@unm.edu)