




Currently Being Prepared
Further Developments - Being Revised and Updated
Continuing Research During 2026 and 2027
Background
The former Division of Government Research (DGR), part of the Institute for Applied Research Services (IARS) at UNM developed a special purpose statewide gravity model for measuring geographic access to health care facilities and providers in New Mexico. This work was performed for the former New Mexico Health Policy Commission (NM HPC) from 1998 through 2002 as an addition to comprehensive statistical work with New Mexico's health care data. The results of this preliminary work were only published on DGR's former web page and also in a limited distribution publication by the NM HPC ( HPC Quick Facts 2003 - color extract). A special poster presentation was also prepared that won the poster contest at the 2002 ESRI SWUG Conference held in Taos, New Mexico ( now Esri Southwest User Conference).
Previous, Current, and Ongoing Developments
This research has focused on evaluating various spatial-statistical methods used for measuring geographic accessibillity to health care facilities and services using the example of primary care. For more background information and results from previous preliminary research please see these web pages:
- Original page (2012 - 2023)
- Additional data preparation and visualization page (2023 - 2024)
- Additional data visualization and preliminary analyses page (2023 - 2024)
- Analyses results and further developments page (2024 - 2025)
- Additional developments (2026)
The intent of this further ongoing research is to expand on this previous research and to incorporate a theoretical
basis for the application of these methods.
I am a geographer with a limited but improving background in public and population health.
I recently completed PH 221 - Introduction to Social, Cultural, Behavior Theory (Spring, 2026).
This class and others have
provided me with additional useful background material
that helped improve my understanding of public and population health
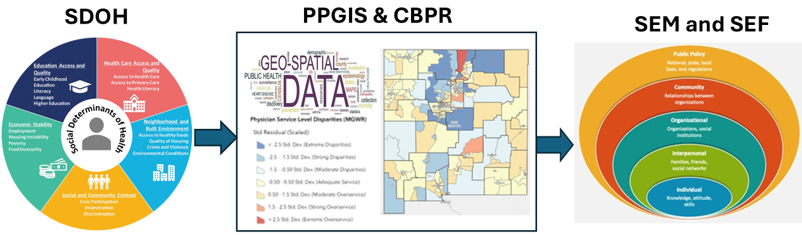
(see graphic below and my Intervention Design Project Poster prepared for this class with more details).
I intend to provide some examples of how selelected spatial-statistical methods can be integrated with established
public and population health theories to help design a future community-oriented intervention project.
These example spatial-statistical methods will be based on the results of the comparative analyses conducted
during previous research.
Hopefully, this work will eventually be conducted with the collaboration of other applied researchers.
This should be an interdisciplinary project composed of state, university, private, and public participants with a
focus on providing the best possible information for policymakers to help improve the quality of health care for all
communities in the state.
Additional Testing and Developments with Older (2020 & 2021) Data
Special Note: These results should be interpreted with caution as the data is not official and is used only to test, evaluate, and illustrate various statistical methods that can eventually be used when current official New Mexico data becomes available. These results are based on the population for census tracts (see 2020 Census Data) and healthcare provider data aggregated to census tracts, and zip codes, plus individual locations. The official routinely updated New Mexico healthcare workforce data by county (see New Mexico Health Care Workforce Committee 2021 Annual Report, pg. 37) shows that an estimated 1,607 primary care physicians were practicing in New Mexico in 2020. The data used for this report is not open source data. Instead I have used a reasonable substitute source for the data available from the Center for Medicare & Medicaid Services (CMS) based on the National Provider Identifier Standard NPI. This data looks to be reliable for testing, although it contains an overcount of 3,078 primary care physicians for New Mexico in 2021. Some of them are no longer active and other discrepancies exist in this data between the State and CMS repotting methods. A Web Map that shows the 2021 (CMS) distribution of primary care physicians has been prepared.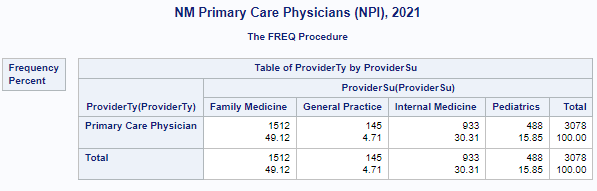
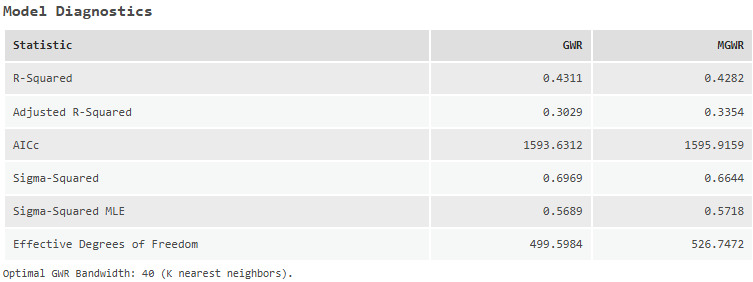
Based on my previous preliminary research and current studies I have decided to statistically compare a composite index based on the social determinants of health (SDOH) health care access and quality domain with another composite index derived from the other three or four SDOH domains. I will develop several versions of the health care access and quality index (HCAQI) as it needs to use results from several variations of 2SFCA/E2SFCA gravity models combined with the percentage of persons without health insurance. Each HCAQI will be statistically compared with several other socio-economic based indexes (SEIs) derived from the other three or four SDOH domains. My previously developed special test SDOH (Index_V1SEH - see PDF and web map) that is based on the North Carolina SDOH (see PDF) and Esri’s Socio-economic Status Index ( ESRI_SEI and web map). I will eventually develop another socio-economic based index modeled after the Public Health Alliance of California’s Healthy Place Index( HPI - web map being prepared). I will be using both geographically weighted regression ( GWR) and multiscale geographically weighted regression ( MGWR) for these statistical comparisons. The intent of these data-driven analyses is to see if these spatial-statistical methods can produce practical, reliable, and potentially useful geographically based measures of health care disparities for New Mexico’s communities. My previous preliminary research (example web map) has indicates that these spatial-statistical models have provided significant improvements compared with tradiditional nonspatial statistical methods and these additional developments are intended to further illustrate their utility.
Note: The 2SFCA/E2SFCA geographic access gravity models can be constructed with primary care physician locations aggregated to either census tracts, zip codes, voting precincts, or reported locations (mostly hospital or clinic work addresses but some home addresses). The aggregate measures are the geographic centers (centroids) of census tracts, zip codes, or voting precincts. When appropriate, a reasonable approximate location closer to settelments in large sparsely populated census tracts, zip codes, and voting precincts will be substituted. My previous research indicated that using zip codes instead of actual physician locations possibly provides more reasonable results for a large state such as New Mexico with dispersed rural and unoccupied areas. However, I will be evaluating a selected series of models using just census tracts, census tracts combined with zip codes, and census tracts with actual physician locations, plus legislative districts with both zip codes and voting precincts. My first thought was to base the selection on the results of previous work using only the gravity models with a particular distance decay function (exponential, Gaussian, power, or modified power - previous developed DGR method) that had the highest Pearson's correlations (nonspatial) with socio-economic indexes. After developing several versions of the health care access and quality index (HCAQI) and comparing the correlations (nonspatial) with socio-economic indexes, I have obtained some different and somewhat better results. Instead, I will use these results to guide my selection of which distance decay function to use for the GWR and MGWR spatial-statistical based analyses. I will continue to use (SAS) and SAS OnDemand for Academics to prepare correlation (nonspatial) tables of these results that have guided my decisions plus other tables and statistical graphics.
I expected to find that there are some significant differences in the results obtained from models that are based on various selected combinations of data collection units (census tracts, zip codes, legislative districts, voting precincts, or individual physician locations) due to the Modifiable Areal Unit Problem MAUP. An understanding of this problem is essential for evaluating results and should facilitate the choice of an appropriate practical and useful models for future use especially for comparing accessibility and disparities among communities. I am also working on developing a hybrid 2SFCA/ES2FCA model that will calculate and combine different accessibility measures for the urban and rural areas. This hybrid 2SFCA/E2SFCA model will use a smaller catchment area for urban areas and a larger catchment area for rural areas. There will be different distance decay functions for the urban and the rural areas. The population of census block groups instead of census tracts may be used for the urban areas.
Additional Note: Most of this long-term research project has been performed using SAS combined with ArcGIS Pro plus Python and R for additional analyses and comparisons of results. Using SAS was a convienent choice for me as I am a long-time SAS user and experienced SAS programmer. There have been some recent developments of geoprocessing tools using Python for ArcGIS Pro thanks to researchers at the University of Tennessee (Hashtarkhani et al., 2024) that were not available during most of my previous work. I plan on using this geoprocessing toolbox in the future to compare some of the results previously obtained with with SAS and also for processing more recent data.
Census Tracts for Both Population and Aggregated Physician Locations ( example web maps)
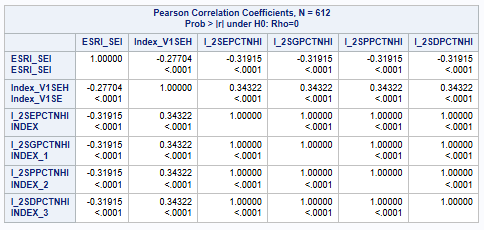
The following table shows the correlations (nonspatial) between
Esri's Socioeconomic Status Index (ESRI_SEI) and
another special socio-economic index (Index_V1SEH) with
two other health care quality and accessibility (HCAQI) indexes.
These other indexes are derived from the combination of results from
Two-Step (2S) Hybrid Zonal (HZ) gravity models
with the percentage of persons without health insurance.
Each gravity model uses
different distance decay functions (E - Exponential, G- Gaussian, P - Power, and D - DGR Power)
that have been prepared using road distances from an Origin-Destination Matrix (ODM).
All the HCAQIs had the same correlation (-0.3195 R^2 0.1019 AdjR^2 0.1004) with the Esri SEI index.
Also, all the HCAQIs had the same correlation (0.34322 R^2 0.1178 AdjR^2 0.1164) with the special index (Index_V1SEH).
Note: As there is no differences in the correlations for each HCAQI with either the ESRI_SEI or Index_V1SEH,
I will use the Gaussian distance based HCAQI for the comparisons and following GWR and MGWR analyses.
Census Tracts (CT - for both Demand/Population and Supply/Physicians)
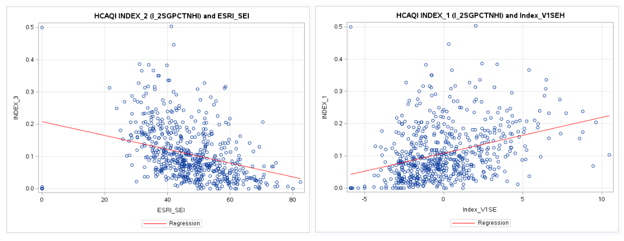
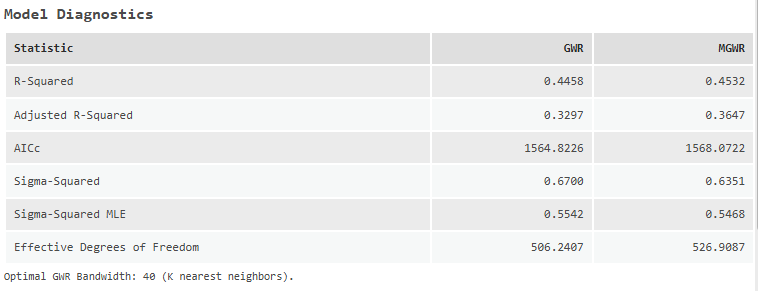
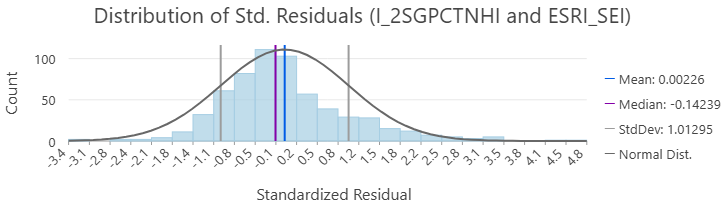
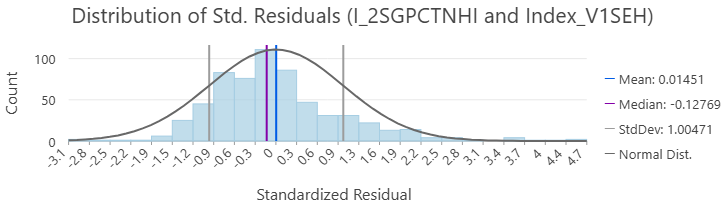
GWR and MGWR Results - I_2SGPCTNHI and Index_V1SEH
Census Tract Population and Zip Code Aggregated Physician Locations ( web maps)
The following table shows the correlations (nonspatial) between
Esri's Socioeconomic Status Index (ESRI_SEI) and
another special socio-economic index (Index_V1SEH) with
two other health care quality and accessibility (HCAQI) indexes.
These other indexes are derived from the combination of results from
Two-Step (2S) Hybrid Zonal (HZ) gravity models
with the percentage of persons without health insurance.
Each gravity model uses
different distance decay functions (E - Exponential, G- Gaussian, P - Power, and D - DGR Power)
that have been prepared using road distances from an Origin-Destination Matrix (ODM).
The HCAQI with modified power (DGR) distance decay function had the larger correlation (0.10934 R^2 0.0120 AdjR^2 0.0103) with the Esri SEI index.
However, the HCAQI with the Gaussian distance decay function had the larger correlation (0.18187 R^2 0.0331 AdjR^2 0.0315) with the special index (Index_V1SEH).
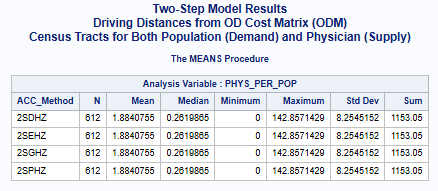
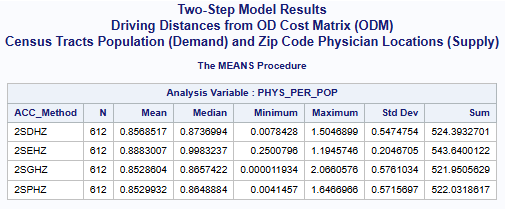
Note: The gravity model results are physician-to-population ratios.
Census Tracts for Demand/Population and ZIP Codes for Supply/Physicians, ODM


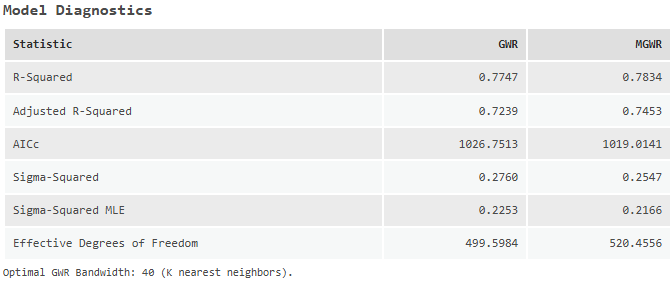
GWR and MGWR Results - I_2SGPCTNHI and Index_V1SEH

Census Tract Population and Physician Locations ( web maps)
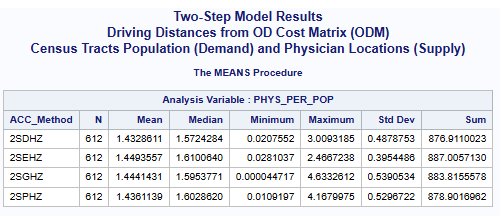
Census Tracts for both Demand/Population and Supply/Physicians, ODM


GWR and MGWR Results - I_2SPPCTNHI and Index_V1SEH


Legislative Districts and Voting Precincts ( example web maps)
Ongoing Developments with Current (2025) Data
Preliminary Discussion (being prepared)
Some Related Links and Publications
- GIS and Public Health
- Quantitative Methods and Socio-Economic Applications in GIS
- Esri's Spatial Statistics Resources
- SPATIAL STATISTICS ILLUSTRATED (Esri Press)
- CDC - Geo-Spatial Data Resources (Archived)
- UCGIS - Geographic Information Science & Technology, Body of Knowledge (BoK)
- Spatial Data Science in ArcGIS (Esri Developer & Technology Summit, 2025)
- Creating a Composite Index: Combining Variables to Make Better Decisions (Esri User Conference, 2025)
- Spatial Data Science in ArcGIS (Esri Developer & Technology Summit, 2026)
- Esri StoryMap - Easily Access and Use American Community Survey (ACS) Data
- Esri Blog - Introducing the Calculate Composite Index Tool
- Esri Blog - Enhanced Social Equity Analysis Solution Released
- Esri Blog - ACS Update Available in ArcGIS Living Atlas (Feb. 2026)
- SAS OnDemand for Academics
Address and Contact Information
 Larry Spear, Sr. Research Scientist (Ret.)
 Division of Government Research
 University of New Mexico

 Email: lspear@unm.edu  lspearnm@gmail.com
 WWW: https://www.unm.edu/~lspear
 LinkedIn https://www.linkedin.com/in/larry-spear-93371970
 UNM's Home Page
Last Revised: 10/15/2026 Larry Spear (lspear@unm.edu)