


Analyses Results - Being Revised and Updated
An Independent Study Project (Geography 691)
Previous Research During 2023 and 2024
Background
The former
Division of Government Research (DGR) at UNM developed a special purpose statewide
gravity model for measuring geographic access to health care facilities and providers
in New Mexico. This work was performed for the former
New Mexico Health Policy Commission (NM HPC) from 1998 through 2002
as an addition to comprehensive statistical work with New Mexico's health care data.
The results of this preliminary work were only
published on DGR's former web page and also in a
limited distribution publication by the NM HPC (
HPC Quick Facts 2003 -
color extract).
A special poster presentation
was also prepared that won the poster contest at the 2002 ESRI SWUG Conference held in Taos, New Mexico (
now Esri Southwest User Conference).
Many academic and applied research studies
have demonstrated the utility of a GIS
(Geographic Information System)
and spatial statistical methods (spatial analysis)
such as gravity models
for public health
(Selected References and
Esri Health and Human Services).
These evolving methods
(GIS-Based Accessibility Measures and Application)
have provided an improved higher resolution understanding of geographic accessibility (potential and relative spatial access)
than the official (traditional epidemiological) lower resolution regional availibility methods routinely used by government agencies.
However there is more research needed to help the selection of an appropriate model(s) to apply in a particular place.
New Mexico has some very unique social, economic, political, and topographic characteristics
that need to be considered when developing and applying these methodologies.
This research will consider these factors and hopefully result in the selection
of an appropriate and useful model(s) to measure geographic accessibility to health care providers and facilities.
Previous Developments
This page presents results from a countinuing comparision and evaluation of the original
DGR gravity model and other one-step gravity-based model methods to some of the more recently
developed two-step gravity-based models used elsewhere by other researchers.
For more background information
and results from previous preliminary research please see
(
Geographic Acces to New Mexico Health Care Providers and Facilities - original page).
A more comprehensive recent update focused on data acquisition, preparation, description and visualization
has been prepared
(see
Geographic Acces to New Mexico Health Care Providers and Facilities - data preparation page).
The primary purpose of the previous and this continuing research is to
allow other researchers to review these results
and to make suggestions to improve the interpretation of these results.
This analyses phase of research is also focused on exploring the use of various computig software and statistical
packages that can be used to evaluate the gravity model results.
Hopefully with the cooperation of others, especially researchers with a public health and statistical background,
portions of this interdisciplinary research may eventully be published
in an appropriate academic journal and presented at both academic and applied users confrences.
The findings of this research should also help promote the application of these methods in New Mexico by various state
governement agencies to assist policymakers in the NM Legislature to make more informed decisions
when allocating resources to help alleviate disparities.
Note: An additional web page
(see
Geographic Acces to New Mexico Health Care Providers and Facilities -
Continuing Analyses and Development) is currently being prepared.
One-Step and Two-Step Model Comparisons
(Models with ODM Road Distances)
A comprehensive comparision of the results of the one-step and-two-step models with standard statistical methods
(t-tests and ANOVA) plus addiditional
exploratory data analysis (eda)
and exploratory spatial data analysis (esda)
techniques are being prepared. It is possible that the one-step and two-step models produce very similar results and there
are no distinct advantage of either. The availability of data and how the models are configured (separation of supply and demand)
plus the type of distance-decay function may be the main factors contributing to
any appreciable differences.
Addressing the tendency of various models to over-predict or under-predict is a more difficult problem,
an important research question that needs to be investigated.
The results from these geographic access models can be compared to measures of health inequality (health disparities) to statistically
evaluate the relationships.
The strength of the correlations or relationships may be helpful to select an appropriate or more useful model(s).
However, this research may indicate that there is a counter-intuitive way of interpreting the poor
correlations with health care inequality and disparity indices plus social determinants of health.
These results may actually indicate how out-of-balance the distribution of primary care physicians actually is in New Mexico.
The various models and their correlations may be useful to show and illustrate a range of statewide geographic accessibility
from poor (weak) to somewhat better (stronger).
I plan to conduct further spatial statistical analyses
using methods such as
Exploratory Regression,
geographically weighted regression,
(GWR)
and the recently developed multiscale geographically weighted regression
(MGWR).
These statistical and spatial methods will be useful to see how results from the potential geographic access gravity models
are related to various measures of health inequality (health disparities)
and social determinants of health (
SDOH).
SAS will continue to be used as it is very helpful for data engineering (data preparation, integration, and wrangling)
and standard statistical analyses.
The SAS OnDemand for Academics
resource has also been invaluable for processing larger data sets very quickly.
A transition to using various Python and
R based methods
plus ArcGIS Insights
will be made during this next phase of work that will include various
spatial statistical methods (
see esri Spatial Statistics Resources).
Some of the models will be recalculated using
ArcGis Pro Script Tools and
ArcGIS Pro Notebooks that will include
statistical methods.
These computing resources will eventually be made available for other researchers to use and modify.
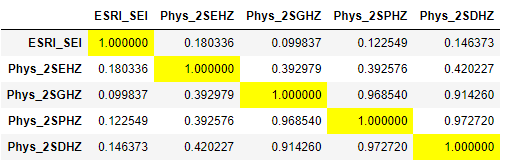
Esri's Socioeconomic Status Index (SEI) Comparisons
Esri's Socioeconomic Status Index
(SEI)
- see Indices section below) for 2022 is being used for comparing selected gravity model results.
This index has been developed using reliable demographic and statistical methods.
Although this index is slightly more recent than the population (2020) and physician (2021) data used
to derive the gravity models, it should be acceptable for the demonstration purposes of this class project.
Note: I am rearching preparing better quality graphics with Python and perhaps with R
(see Graphics Tests PDF).
Some results will be available soon.
Census Tracts (CT - for both Demand/Population and Supply/Physicians):
The following Python(pandas) table shows:
Correlations between Esri's Socioeconomic Status Index (SEI) and either
One-Step or Two-Step (2S) Hybrid Zonal (HZ) gravity models
with different distance decay functions (E - Exponential, G- Gaussian, P - Power, and D - DGR Power).
Using road distances Origin-Destination Matrix (ODM).
Esri SEI and 2S Gravity Models (CTCT - ODM)
Census Tracts (CT - for both Demand/Population and Supply/Physicians)
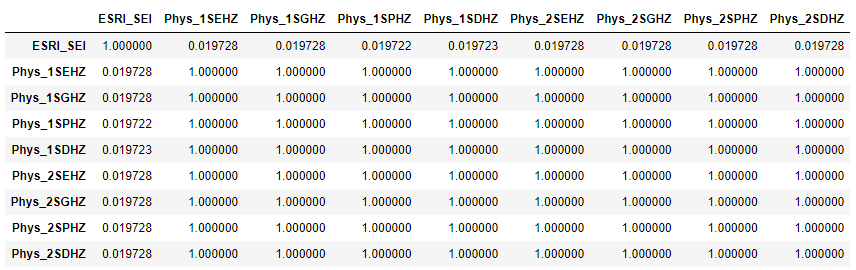
The resulting correlations are very weak indicating a poor relationship between the
Esri socioeconomic status index (SEI) and both the one-step (1S) and two-step (2S) gravity models using road
distances from an origin-destination matrix (ODM).
Additional analyses with this type of gravity model (census tracts for supply and demand) are planned.
These results could improve when using other indices (to be developed) and multiple regression methods.
If so, it will be possible to further explore this type of gravity model application.
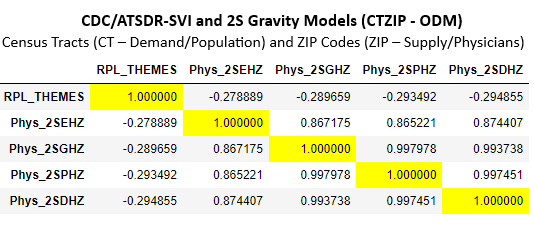
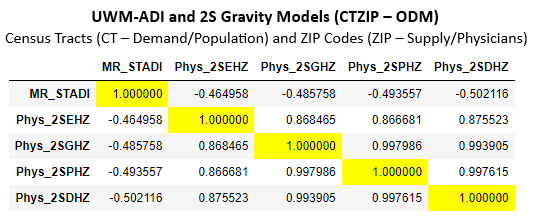
Census Tracts (CT - Demand/Population) and ZIP Codes (ZIP - Supply/Physicians):
The following Python(pandas) table shows:
Correlations between
Esri's Socioeconomic Status Index (SEI) and a
Two-Step (2S) Hybrid Zonal (HZ) gravity models
with different distance decay functions (E - Exponential, G- Gaussian, P - Power, and D - DGR Power).
Prepared using road distances from an Origin-Destination Matrix (ODM).
Note: The gravity model results are physician-to-population ratios.
Various data transformation methods to produce more normal distributions will be evaluated
to improve the regression results.
Esri SEI and 2S Gravity Models (CTZIP - ODM)
Census Tracts (CT - Demand/Population) and ZIP Codes (ZIP - Supply/Physicians)
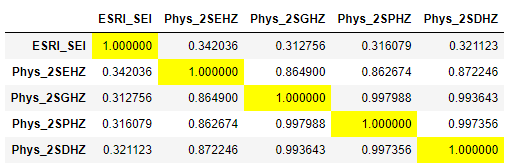
The resulting correlations are very weak indicating a poor relationship between the
Esri socioeconomic status index (SEI) and the two-step (2S) gravity models using road
distances from an origin-destination matrix (ODM).
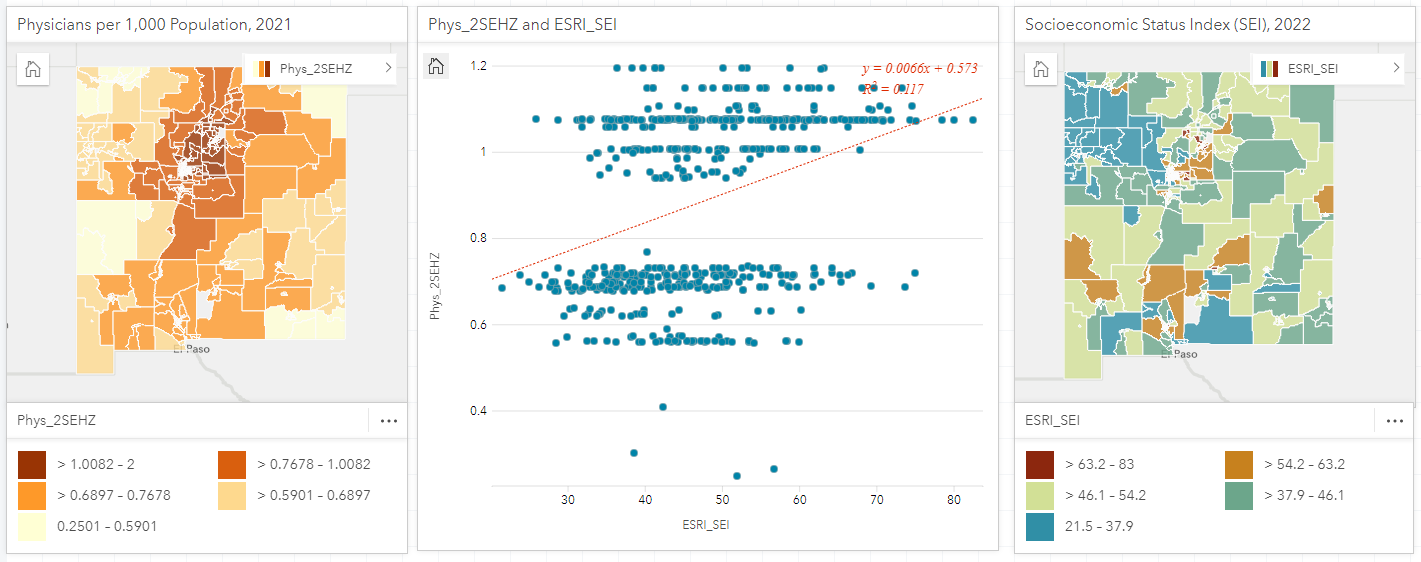
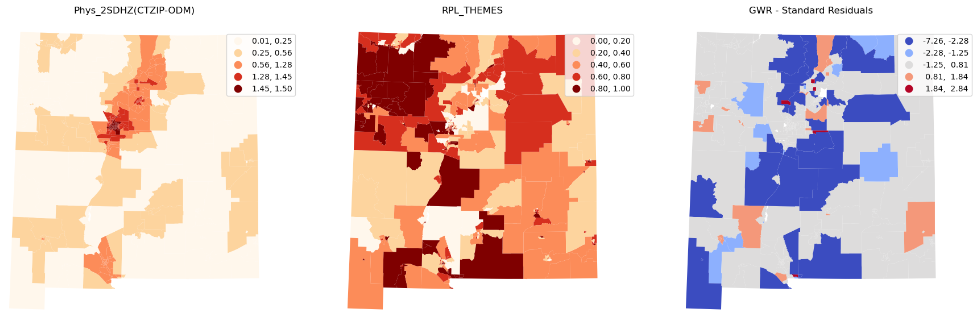
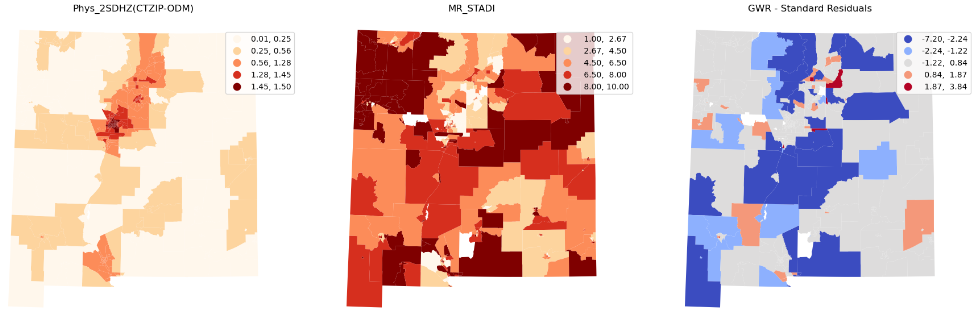
Regardless, I decided to use this census tract and ZIP code model with an exponential distance decay function (Phys_2SEHZ)
as a test and example of the types of analyses that can be conducted in the future with the results from other gravity models.
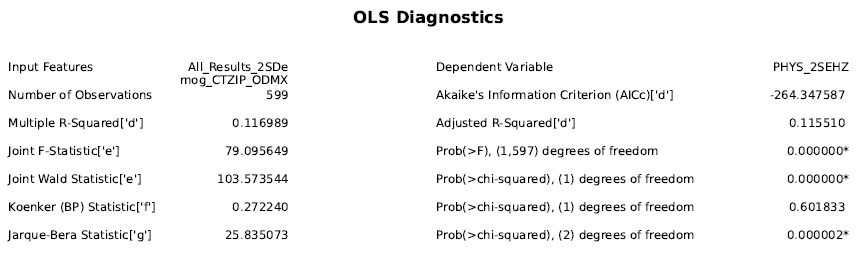
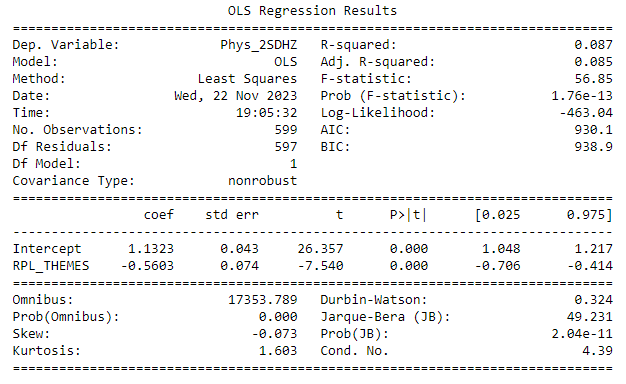
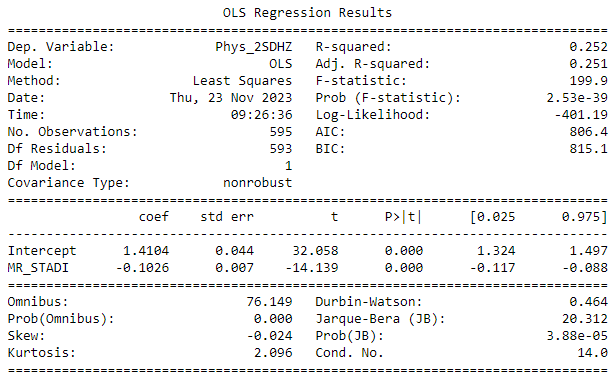
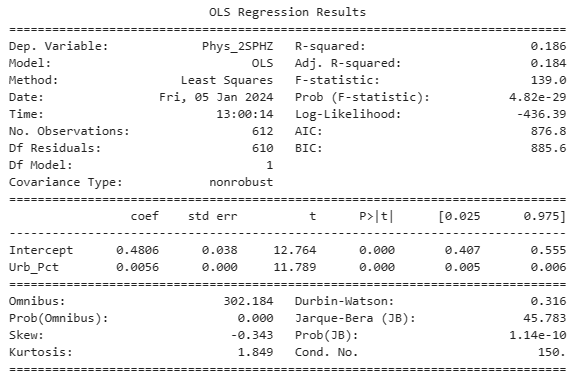
I first used Ordinary Least Squares Regression (
OLS)
and
Generalized Linear Regression (
GLR)
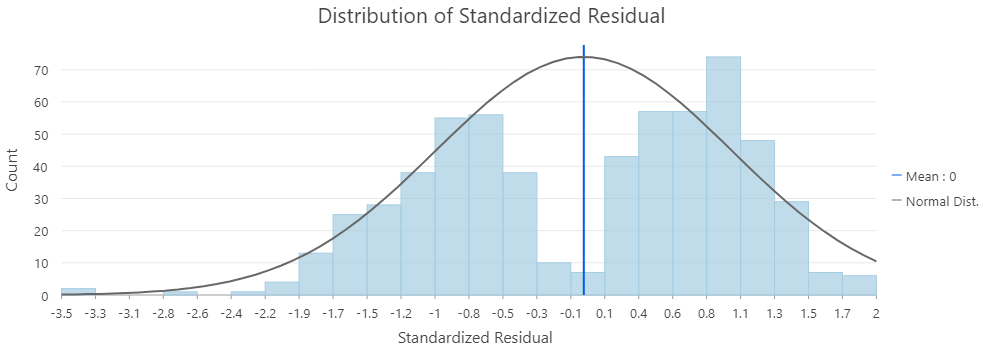
and also prepared maps of the standardized residuals to explore these results.
The non-spatial relationship is very weak although significant, and looks consistent across data and geographic space (see OLS Diagnostics below).
The residual plot (see below) is not normal which is a strong indication of a nonlinear relationship with outliers.
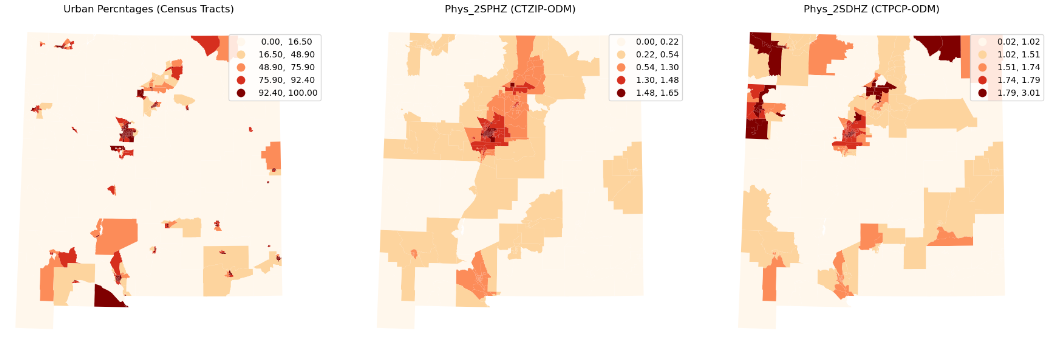
However, this routine method of mapping regression residuals
produces an interesting spatial pattern that warrants more investigation (see a test map,
PDF ).
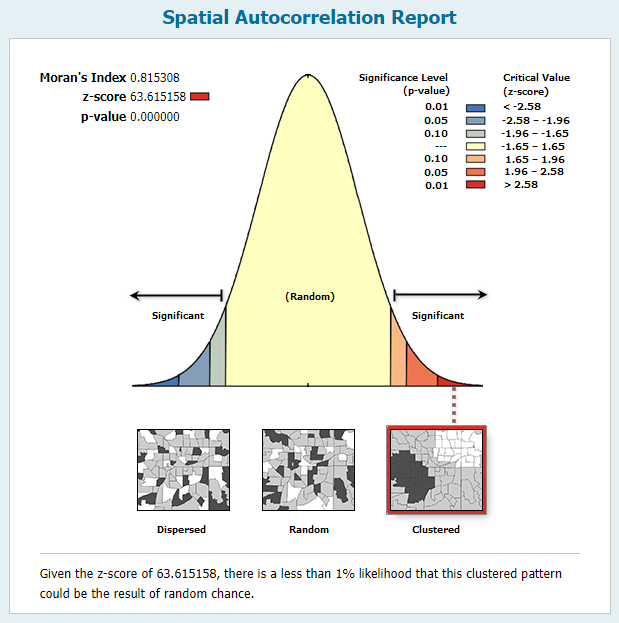
The residuals are most likely spatially clustered (spatial autocorrelation) wich is an indication
that the model could be improved with the addition of more explanatory variables (other relevant social and healthcare related indices).
This is easy to check with ArcGIS using Global Moran's I and the results (see below) clearly show how extremely clustered the standardized residuals are.
However, after further modifications, this could be a promising method in the future for calculating and displaying
socioeconomic and other healthcare service level disparities.
The results using spatial regression methods should be even more promising, although this simple one explanatory variable model is
not the best example and should be expanded.
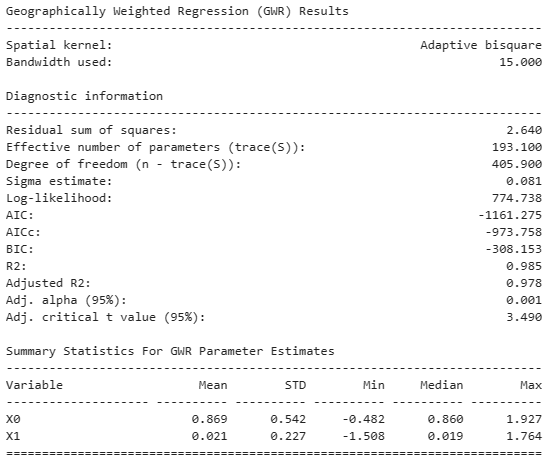
Additional analyses using
(GWR)
and the recently developed multiscale geographically weighted regression
(MGWR)
are being prepared to see if there are any noticeable improvements.
I have encountered some errors and warnings using the ArcGIS Pro implementations of these methods that I need to better understand.
Some initial tests of these methods have not produced any results
due to some unexpected errors (Ex. ERROR 110242: There is not enough variation in the Dependent Variable for at least one local neighborhood.)
that still need to be resolved.
I am learning more about these methods and will be performing additional testing using
an open-source python package of MGWR and GWR (see
ASU - MGWR)
and a spatial data analysis program (see UChicago - GeoDa).
There is a QGIS Python plugin (see Spatial Analysis Toolbox)
and some R packages
(see spgwr and
mgwrsar) that also may help to see if improvements can be made.
In addition, I have used ArcGIS Insights
to conduct addidtonal analyses and prepare graphics.
ArcGIS Insights (OLS)
Example Web Maps
View the Esri (GLR and MGWR) Web Map in a new tab
Toggle side panel (top left) for Zoom, Layers, and Legend
(Click map feature for pop-up information)
View the ASU-MGWR (OLS, GWR, and MGWR) Web Map in a new tab
Toggle side panel (top left) for Zoom, Layers, and Legend
(Click map feature for pop-up information)
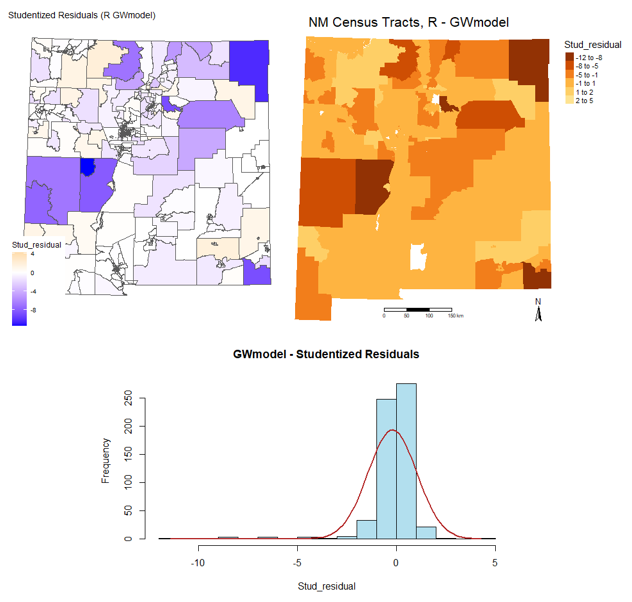
I am using R to carry out additional analyses and compare results.
The following basic maps of studentized residuals (being improved)
were produced using the R packages
GWmodel,
ggplot2
and tmap
plus others that are part of tidyverse
collection of packages.
These maps show the studentized residuals from the geographically weighted regression (GWR) of Esri SEI and Phys_2SEHZ.
They are similar to the web maps of standardized residuals (see above) from the GWR analyses using those python package but
the studentized residuals more clearly emphasizes the outliers as shown in the histogram (see below).
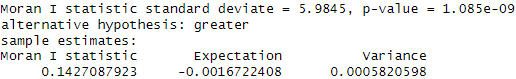
In addition, a global Moran's I analysis to test for spatial autocorrelation was performed following the
example (
A basic introduction to Moran's I analysis in R)
provided by Manny Gimond
as part of his Intro to GIS and Spatial Analysis
class at Colby College.
The results (see below) clearly indicates that the studentized residuals are clustered and not a random spatial pattern.
Perhaps an appropriate data transformation of the gravity model results (Phys_2SEHZ) could result in a more normal distribution
of the studentized residuals.
I am also preparing some more detailed web maps using
leaflet.
that will help these comparisons and contrast the differences.
In addition, I am also using ArcGIS Insights
to conduct addidtonal analyses and prepare graphics to supplement the results from both R and Python. The ArcGIS Insights graphic (above)
clearly depicts the bimodal nature of the 2SEHZ gravity model results. This may clearly show the difference between the
potential geographic accessibility to primary care between the urban and rural areas of the state. However, more research is planned to hopefully
better illustrate this disparity and develop a more realistic mixed model that better measures this.
These example comparative analyses have indicated that the distribution of primary care physicians do not
adequately match the distribution of socio-economic status aspects of the populations in New Mexico.
Although most of the urbanized areas seem to be adequately in balance with their socio-economic status characteristics,
some of the rural areas are not in balance.
This rural disparity or potential under-service is clearly shown on the map by the areas (census tracts) with very high negative
studentized residuals.
However it is very important to note that this is only an example of the types of analyses that can be performed.
Additional data using other socio-economic and health related indices could improve these results and are planned.
CDC's Social Vulnerability Index (SVI) Comparisons
The following Python(pandas) table shows:
Correlations between the
CDC's Social Vulnerability Index (SVI).
and either a
One-Step or Two-Step (2S) Hybrid Zonal (HZ) gravity models
with different distance decay functions (E - Exponential, G- Gaussian, P - Power, and D - DGR Power).
Prepared using road distances from an Origin-Destination Matrix (ODM).
Additional analyses comparing results from the gravity models using the ODM are being prepared.
Note: The gravity model results are physician-to-population ratios.
Standardization and various data transformation methods to produce more normal distributions will be evaluated
to improve the regression results.
I am using Python -
ANACONDA (
Jupyter Notebooks - JupyterLab and
ArcGIS Pro Notebooks)
with
PySAL,
PySAL/MGWR,
statsmodels and
seaborn
for these comparisons.
I have found the Introduction to GWR and MGWR by Carlos Mendez to be a very helpful resource.
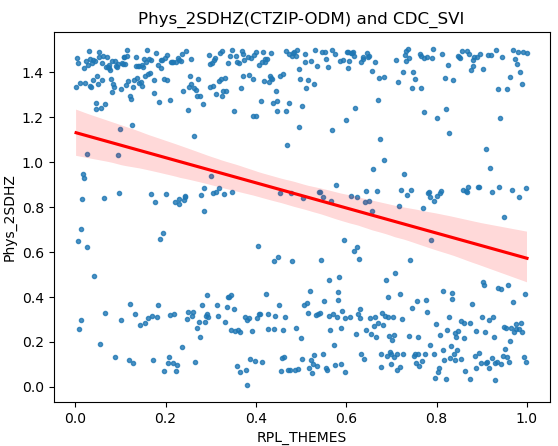
These results show a very weak correlation between the the Phys_2SDHZ gravity model results and the CDC_SVI.
The ordinary least squares regression results also show a weak negative relationship which seems to be
due to the bimodal nature of Phys_2SDHZ distribution. This is likely a function of the urban/rural disparity
in the location and availability of primary care physicians. However, more research is planned to hopefully
better illustrate this disparity (additional graphics plus a webmap of GWR residuals are being prepared)
and to develop a more realistic mixed model that better measures this.
UWM's Area Deprivation Index (ADI) Comparisons
The following Python(pandas) table shows:
Correlations between
UWM's Area Deprivation Index (ADI) and either a
One-Step or Two-Step (2S) Hybrid Zonal (HZ) gravity models
with different distance decay functions (E - Exponential, G- Gaussian, P - Power, and D - DGR Power).
Prepared using road distances from an Origin-Destination Matrix (ODM).
Additional analyses comparing results from the gravity models using the ODM are being prepared.
Note: The gravity model results are physician-to-population ratios.
Standardization and various data transformation methods to produce more normal distributions will be evaluated
to improve the regression results.
I am using Python -
ANACONDA (
Jupyter Notebooks - JupyterLab and
ArcGIS Pro Notebooks)
with
PySAL,
PySAL/MGWR,
statsmodels and
seaborn
for these comparisons.
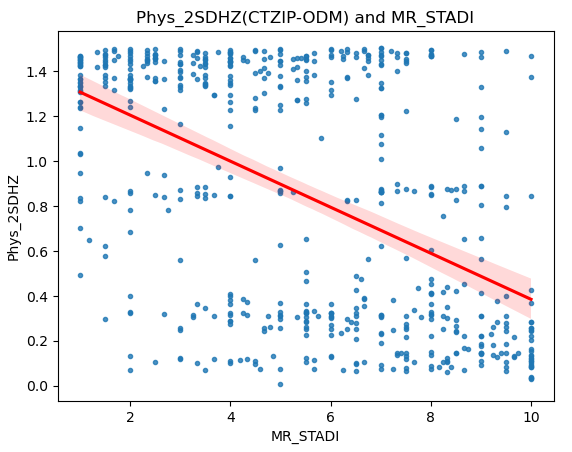

These results show a weak correlation between the the Phys_2SDHZ gravity model results and the MR_STADI.
The ordinary least squares regression results also show a weak negative relationship which seems to be
due to the bimodal nature of Phys_2SDHZ distribution. This is likely a function of the urban/rural disparity
in the location and availability of primary care physicians. However, more research is planned to hopefully
better illustrate this disparity (additional graphics plus a webmap of GWR residuals are being prepared)
and to develop a more realistic mixed model that better measures this.
Census Tracts (CT - Demand/Population) and Physician Locations (Phys - Supply/Physicians):
The following Python(pandas) table shows:
Correlations between Esri's Socioeconomic Status Index (SEI) and either a
One-Step or Two-Step (2S) Hybrid Zonal (HZ) gravity models
with different distance decay functions (E - Exponential, G- Gaussian, P - Power, and D - DGR Power).
Prepared using road distances from an Origin-Destination Matrix (ODM).
Esri SEI and 2S Gravity Models (CTPhys - ODM)
Census Tracts (CT - Demand/Population) and Physician Locations (Phys - Supply/Physicians).
The resulting correlations are disappointingly very weak indicating a poor relationship between the
Esri socioeconomic status index (SEI) and the two-step (2S) gravity models using road
distances from an origin-destination matrix (ODM).
Additional analyses for this gravity model census tract (demand) and physicians (supply) type application are planned.
These results could improve when using other indices (to be developed) and multiple regression methods.
If so, it will be possible to further explore this type of gravity model application.
Social and Health Disparities Indices Discussion
There is a large amount of recent research and development related to understanding, developing, and applying the
concept of social determinants of health (SHOH).
The generally accepted definition are the non-medical factors
("conditions in which people are born, grow, work, live, and age") that influence health outcomes.
An more in-depth review of this concept and current research is beyond the focus of this class project.
However, there are some current reviews
Social Determinants of Health: Areview of Publicly Available Indices and
What Are the Top Common Social Determinants of Health?
that are very useful for providing a better understanding of this concept.
For this class project I hope to develop a very basic SDOH Index for New Mexico that can be used for comparing the
results from the various geographic access to healthcare gravity models.
Hopefully other researchers with more expertise and resources will eventually work on subsequent developments as the
New Mexico Department of Health has not yet developed a composite SDOH Index (see NMDOH Social Determinants of Health) similar to those developed in other states.
There are several other related indices (see below) and currently available statistical and computing resources that
can provide useful examples, aspects and help for future developments.
Several methods to classify rural or urban census tracts
(see Rural Definitions for Health Policy and
Rural-Urban New Mexico, Healthcare Access)
have been developed.
Plus the CDC has a well developed Social Vulnerability Index (SVI)
for census tracts
and the the Department of Health and Human Services maintains the
Social Determinants of Health Database (
AHRQ SDOH Database).
Also a neighborhood Area Deprivation Index (ADI)
for census block groups is available and
there is a recently developed R package geomarker-io
that can be used to calculate a community deprivation index (CDI)
using the Census Bureau's American Community Survey
(ACS) census tract data.
Another potentially useful resource is the
Climate and Economic Justice Screening Tool (Justice 40).
These classifications and other socio-economic and demographic attributes used to identify
Health Professional Shortage Areas (HPSAs)
and Medically Underserviced Areas (MUAs)
will be evaluated as possible components of several spatial statistical models
(see Esri Spatial Statistics Resources).
I am currently researching the possibility of developing a composite index/indicator (see
Esri Technical Paper and
Calculate Composite Index Tool (Spatial Statistics))
from the spatial combination of these and other data sources.
However, these previously developed incices are at different levels of geography (counties, census blocks or tracts) and many are based on
the Census Bureau's American Community Survey (ACS)
and are currently only available for 2010 census geography.
It may be better to develop similiar indices for subsequent analyses that will include more recent data from the
2020 census as it is made available from the Census Bureau
at the census tract and block group geographic levels.
Recent census data will also be available for
geoenrichment
from Esri's
ArcGIS Living Atlas
using the
Data Enrichment
service and these recent data have been used to develop their Socioeconomic Status Index
(SEI).
Another good example of these types of indices is the Index of Multiple Deprivation (
IMD) used in the United Kingdom. There are various useful aspects of this well-developed indice that will be helpful in preparing
a similar indice for use in New Mexico.
Esri's Socioeconomic Status Index (SEI)
Esri's Socioeconomic Status Index
(SEI)
for 2022 is being used for comparing selected gravity model results.
This index has been developed using reliable demographic and statistical methods.
Although this index is slightly more recent than the population (2020) and physician (2021) data used
to derive the gravity models, it should be acceptable for the demonstration purposes of this class project.
A webmap
showing the statewide distribution of this index has been prepared.
See the Esri's Socioeconomic Status Index (SEI) comparisions section (above) for analyses results.
CDC's Social Vulnerability Index (SVI)
See the CDC's Social Vulnerability Index (SVI) comparisions section (above - being prepared) for analyses results.
For New Mexico there were only 600 of the 612 census tracts with valid data for the
Social Vulnerability Index (SVI).
This is because some census tracts contain group quaters (dormitories, prisons, etc.) where the population was not counted.
A webmap
showing the statewide distribution of this index has been prepared.
UWM's Area Deprivation Index (ADI)
See the UWM's Area Deprivation Index (ADI) comparisions section (above - being prepared) for analyses results.
For the United States the
Area Deprivation Index (ADI)
is available only at the census block group or ZIP Code (ZCTA?) levels of geography.
I was able to aggregate the census block groups to census tracts and used the average (MR - rounded mean) value of
the block groups that composed the census tracts. There were 595 of the 612 census tracts that contained valid data
as some block group data were suppressed (low population or housing group quarters).
However these results should be viewed with caution as there is a potential for statististical bias and excessive
variation due to the MAUP.
A webmap
showing the statewide distribution of this index has been prepared.
AHRQ Social Determinants of Health (SDOH) Database
I will be using the Agency for Healthcare Research and Quality (AHRQ), US Department of Health and Human Services
Social Determinants of Health Database (
AHRQ SDOH Database)
for subsequent analyses similar to that currently being conducted using Esri's SEI.
This data source has recently been updated to include both 2020 Census tracts and ZIP Codes for the entire US.
I should be able to develop a reasonable composite SDOH Index for New Mexico from the combination of selected
data items available in this resource and
recent census data also available from Esri's
Data Enrichment service.
This will require further research (see
Social Dererminants of Health: A Review of Publicly Available Indices)
and a reliance on developments made by researchers in other places as
New Mexico has not yet developed a composite SDOH Index (see NMDOH Social Determinants of Health).
Some basic composite SDOH indexes have been developed and demonstrated with interactive story maps. For examples see (
North Carolina Social Determinants of Health (
also PDF)
and Mapping SDOH by the Carolinas HealthCare System).
It should be possible to apply similar statistical methods used by these researchers to develop a useful
basic composite SDOH Index for New Mexico.
Subsequent refinments can eventually be made using more extensive data and sopthisticted methods as illustrated by the
Public Health Alliance of Southern California's Healthy Places Index (PDF),
Colorado's Social Determinants & Community Health (Story Map) and others.
As this work progresses there will be a webmap plus an analyses section (see above).
Justice 40 Initative Criteria
The Council on Environmental Quality (CEQ)
has prepared the Climate and Economic Justice Screening Tool
that contains various indicators (indices) of burden that will be used in subsequent analyses.
This data can also be accesed from the
Justice 40 Atlas and others available on the
ArcGIS Living Atlas of the World.
Note: I had hoped to use this data but it is still based on the 2010 census tracts.
I will consider exploring the possibility of
GIS overlay analysis
methods to make this data
somewhat compatible with the 2020 census tracts in the future.
Mixed Model Analyses
Depending on the results of the comparisons of the one-step and two-step gravity model methods,
the results may indicate that
a particular model may be more suitable and potentially useful for a statewide (combined rural and urban)
application and another more suitable and potentially useful for separate
urbanized areas and their more populated surroundings.
I will be using the
Urban and Rural Population Data (US 2020 Census)
prepared by esri-demographics available from the
ArcGIS Living Atlas of the World
to investigate the possibility of creating a mixed or hybrid gravity model.
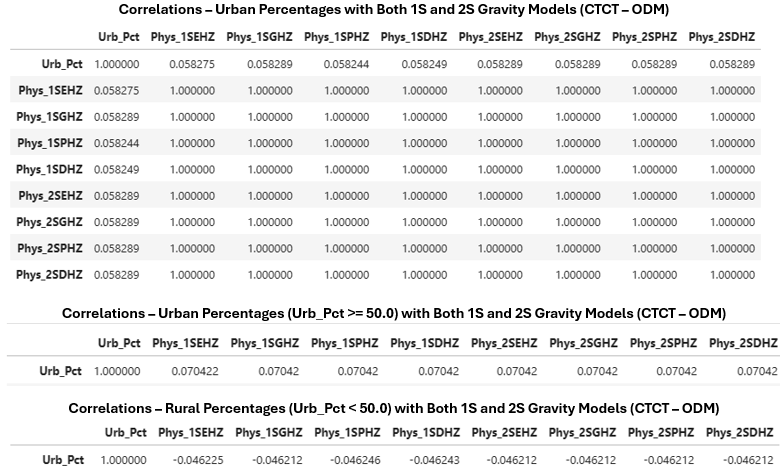
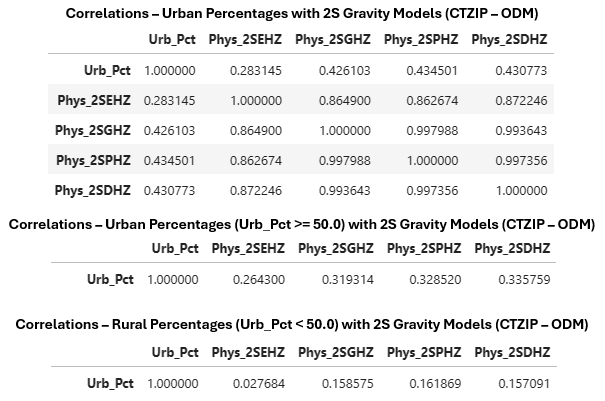
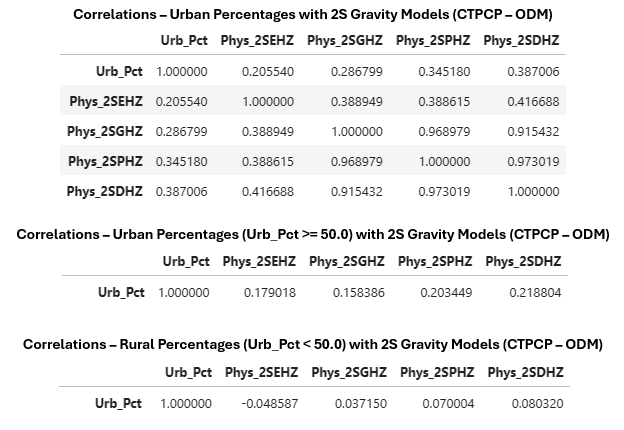
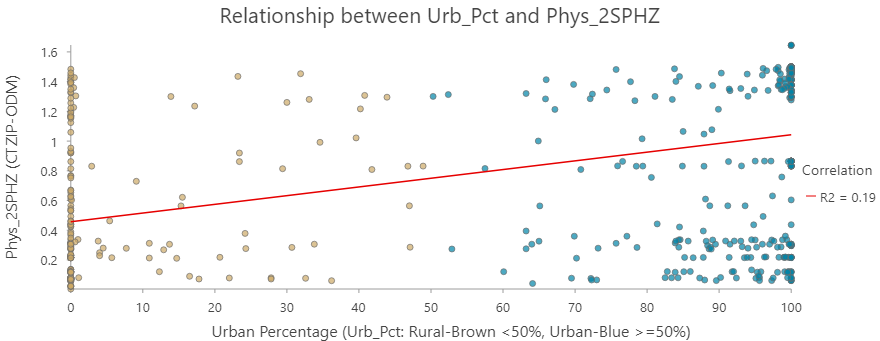
Results for the correlations between urban and rural percentages and the various gravity
models are presented below. Correlations were prepared for all census tracts (n = 612)
urban census tracts (n = 424), and rural census tracts (n = 188) with urban percentages.
Note: Urban census tracts (Urb_Pct >= 50.0) and rural census tracts (Urb_Pct < 50.0) were chosen as a reasonable
way to initially define urban or rural census tracts.
The percentage of urban and rural areas for census tracts can be used as an additional independent
(explanatory) variable in statistical regression models.
A mixture of geodesic distances and
road network distances or travel times may also be evaluated if the results indicate potential utility.
Additional work that focuses on the development and application of a mixed or hybrid gravity model is planned.
Current results indicate a weak relationship between various gravity models and urban/rural
census tract classifications.
The relationship are mostly weaker when either urban (Urb_Pct >=50.0) and rural (Urb_Pct < 50.0) are evaluated.
Developing a useful multiple regression model using additional socioeconomic and health related indices will be prepared.
This multiple regression model will be developed with the help of exploratory regression.
It may also be necessary to additionally investigate the performance of selected higher resolution gravity models
in an urban setting that use census block groups instead of census tracts for population (demand).
I hope to get some assistance preparing this hybrid model from other researchers based on the current
and further statistical results.
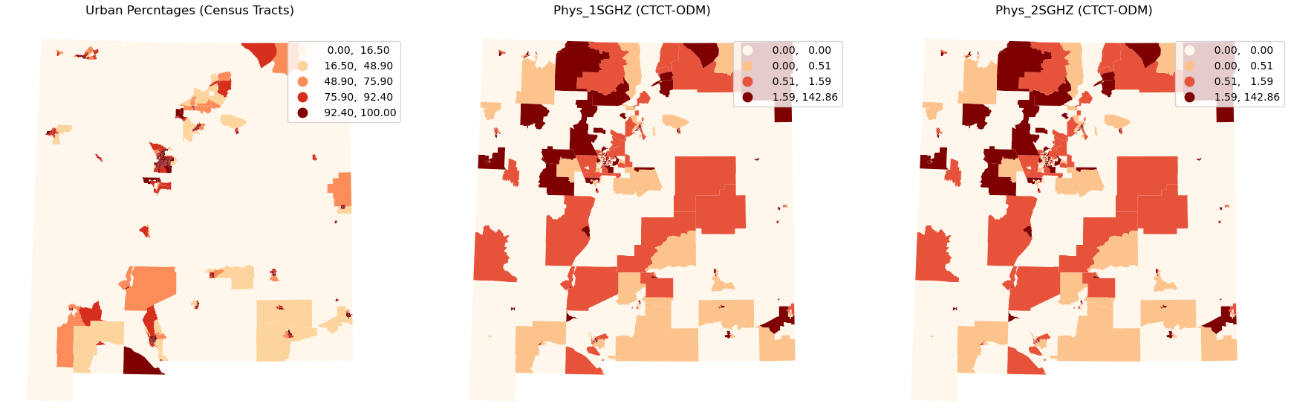
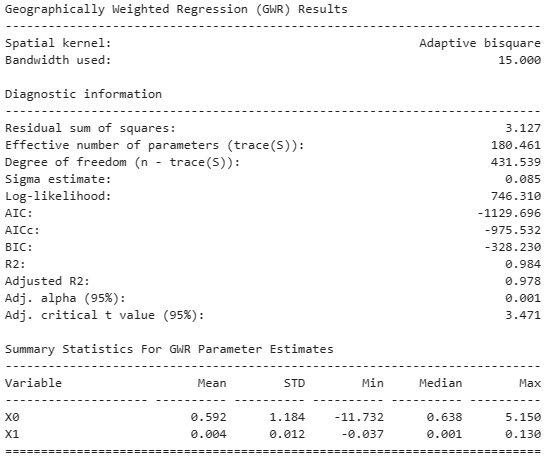
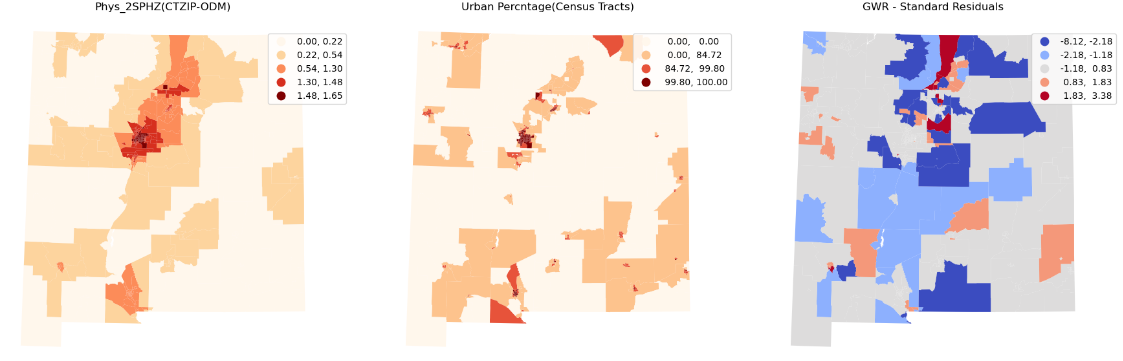
Note: The following GWR results should be viewed with caution.
A warning (LinAlgWarning: - the results may not be accurate) was obtained using a python notebook with mgwr.gwr.
This completely failed using the desktop version of MGWR (LinAlgError: Matrix is Singular).
As the matrix is singular (no multiplicative inverse, determinant is zero), the resulting linear algebra calculations
may not be accurate.
It could be that there are too many same values (0 and 100) of urban percentage (Urb_Pct).
This is an indication that urban percentage should be evaluated for use in combination with other indices.
Developing a useful multiple regression model with the help of exploratory regression is currently being prepared.
Please see the
Continuing Analyses and Development page for recent developments.
Summary and Preliminary Conclusions
Unfortunately I was not able to complete as many of the analyses that I would have liked in this phase of
work. As such, these results should be considered mostly preliminary. I will continue this
research on this page and also in another web page that will focus mostly on developing a mixed model to
hopefully more realistically measure the urban/rural disparities with comparisions to a SDOH index.
However, the current work has been useful for refreshing my computing and
statistical skills and to learn about recent developments. The following are some of the issues that I now
have a better understanding of that can be addressed by subsequent research:
- There is not enough reasonable statistical evidence to conclude that any potential geographic access gravity
model is more realistic than any other. Instead each model is likely illustrating a possible
measure among a range of potential accessibility measures. In essence, all the models have some practical
utility. Deciding which one or combination is the most appropriate given a particular research objective is
somewhat subjective.
- There is evidence that the potential geographic accessibility gravity models are useful to show that differences exist
between urban and rural areas of the state. This disparity needs further exploration. The development of mixed
models that are more applicable to measuring this observation is an important topic for further research.
- The standard physician-to-population ratio (PPR) is the most appropriate measure for initial presentiations
to policy makers and public audiences. However, standardization and various statistical data transformations should be evaluated
and used for subsequent analyses. Regression analysis and subsequent residual maps can possibly be improved by standardizing or
perhaps normalizing the PPR (dependent or response variable) with measures such as the SPAR (Spatial Access Ratio) and others
such as conventional log transformations.
Note: Normalization of independent (predictor) variables is not necesary but can be helpful with highly skewed data.
The various socioeconomic, vulnerability, and health related indices have been standardized.
- Regression analyses with only one independent variable such as any of the socioeconomic, vulnerability, or health
related indices may not be very informative. Ordinary least squares (OLS), general linear models (GLM), and basic
geographically weighted reqression (GWR) can serve as initial first steps. But using multiscale geographically weighted
regression (MGWR) may not be appropriate with only one independent variable.
- The possibility of combining several socioeconomic, vulnerability, and health related indices using multiple regression
techniques and MGWR needs to be explored. Exploratory regression will be helpful for developing useful multiple regression models.
A basic SDOH for New Mexico needs to be developed to be included in these analyses.
But the problem of multicollinearity needs to be addressed.
- Open-source statistical data base software facilities within R and Python have evolved and are now easier to use in
Jupyter Notebooks that facilitate sharing and development.
However there are desktop versions of MGWR and GeoDa that are even easier to use.
Commercial desktop software such as ArcGIS Pro and SAS now have many of the necessary functions for this type of research.
I will continue to do some of the subsequent analyses using the academic versions of these commercial software packages
in combination with open-source software.
If funding for this rsearch becomes available, I will acquire an appropriate academic license for the commercial software.
I also need to do some additional development in QGIS which I have not used recently.
- After a mixed urban/rural model is developed and tested, it can be demonstrated using both New Mexico Legislative
Districts and perhaps New Mexico Department of Health Small Areas.
Selected Links and Publications
I recently prepared a literature review and a very brief
power point class presentation
for Geography 601 (Intro to Geographic Theory and Application, Fall 2021).
I will be providing a link to some of the publications and web resources I found useful.
As this is an ongoing research project, I will include some additional more recent items in the future.
Address and Contact Information
     Larry Spear, Sr. Research Scientist (Ret.)
     Division of Government Research
     University of New Mexico

     Email: lspear@unm.edu  lspearnm@gmail.com
     WWW: https://www.unm.edu/~lspear
     LinkedIn https://www.linkedin.com/in/larry-spear-93371970
 UNM's Home Page
Last Revised: 1/13/2024 and 6/22/2026 Larry Spear (lspear@unm.edu)