© The University of New Mexico, Albuquerque, NM 87131, (505) 277-0111
Below, I provide a framework for you to become more familiar with the ArcMap environment. The assignment uses shapefiles for the counties of New Mexico and for pan evaporation stations in New Mexico. This assignment has similarities and was originally based on one Maidment uses in his course with data for Texas.
Use ftp to get the necessary shapefiles
for this assignment from the cegis account. (When you
login to your account, note that you are in a directory that starts
with the first letter of your netID. For example, my nedID is
jcoonrod. When I login to my account using ftp, in the upper
right of the window, I can see that I am accessing j/jcoonrod.
Similarly, if your netID were ebaca, you'd see e/ebaca.
Thus, to see the files in cegis, we need to go to
c/cegis. Simply backspace over your directory and netID name
and type c/cegis. Then you will see the files for the class
and be able to transfer them to your local computer (or USB drive).)
Click on any image in the tutorial to open an enlarged version in a new window. All Chapter references are from the green book.
1) Open ArcGIS and Create a new map document. Leave the default geodatabase as-is for this assignment, we will talk more about geodatabases in the next assignment.
3) Save the new map document. Choose a place on your USB key if working from UNM lab computers. ArcGIS will crash at the most inopportune moment, save your work regularly!
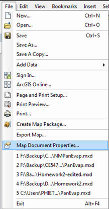
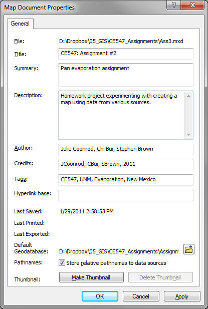
4) Go to File > Map Document Properties. Enter all the relevant information about this project. This information is called Metadata and provides details about the map you have created. Metadata is a critical component of GIS for both final maps and individual layers (shapefiles, raster data, etc.). Finally, check “Store relative pathnames to data sources”. This prevents problems with directory names when moving maps to different computers.
 |
 |
5) Add a base-map to aid visualization. Click the little down arrow next to the plus sign to access the Add Basemap dialog box.
6) Add pan evaporation data and New Mexico shapefile into the map document. Local shapefiles are added with the Add Data tool. You should see some small dots over New Mexico. Zoom in for a better view.
7) Right click on the pan evaporation layer then choose properties to access the layer properties. Go to the symbology tab, select Quantities > Graduated symbols. For Value choose Annual then click Apply. You should now have basic symbology applied to your map that shows symbols increasing in size as the annual evaporation increases. Play with the Template and Classification setting to create an interesting map. Refer to Chapter 5 for more information on symbolizing features.
8) Label the pan evaporation data. Go to the Labels tab, click Label features in this layer. Under "Text String" choose STATION_NAM and click Apply. You should now see labels on all your pan locations. Play with the labels settings to produce a nice map. Refer to Chapter 7 for more information on labeling features.
9) Open the attribute table
of the pan evaporation data to show some statistics.
10) Add a second data frame to show the location of New Mexico with respect to the entire United States.
To add a graph to your layout, Go to View > Graphs > Create to open the Create Graph Wizards. Refer to Chapter 11 for more information on creating graphs.
Be creative with this assignment and see if you can create a layout that “tells a story” about pan evaporation in New Mexico. Print the layout and post the layout on your webpage. Also turn in a brief explanation of what you did and any major difficulties that you had. Take a look at students assignments from previous years for mapping ideas. Have fun (I hope!)