© The University of New Mexico, Albuquerque, NM 87131, (505) 277-0111 /p>

This assignment will expose you to national basin datasets and importing external spatial and temporal data into ArcGIS.
a) National hydrology datasets: The basemap data for this assignment is from the USGS maps site. We will be using Hydrologic Unit Maps, National Hydrography Datasets, and NHD Dam Events.
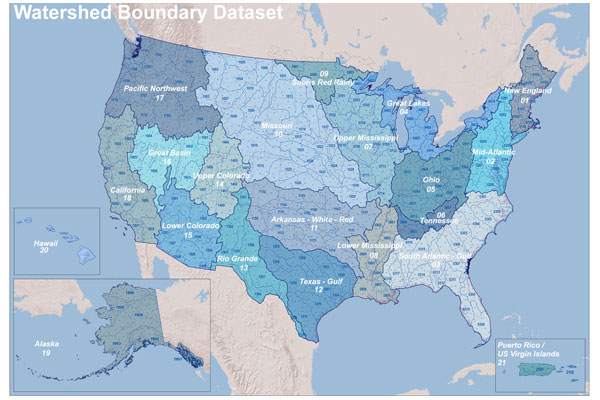
Watershed boundary dataset showing major hydrologic unit codes (HUC)
b) Getting the data: Data acquisition for this project has been streamlined for you. Download Assignment5.gdb.zip from CEGIS and unzip the Geodatabase. Set this as your default map database.
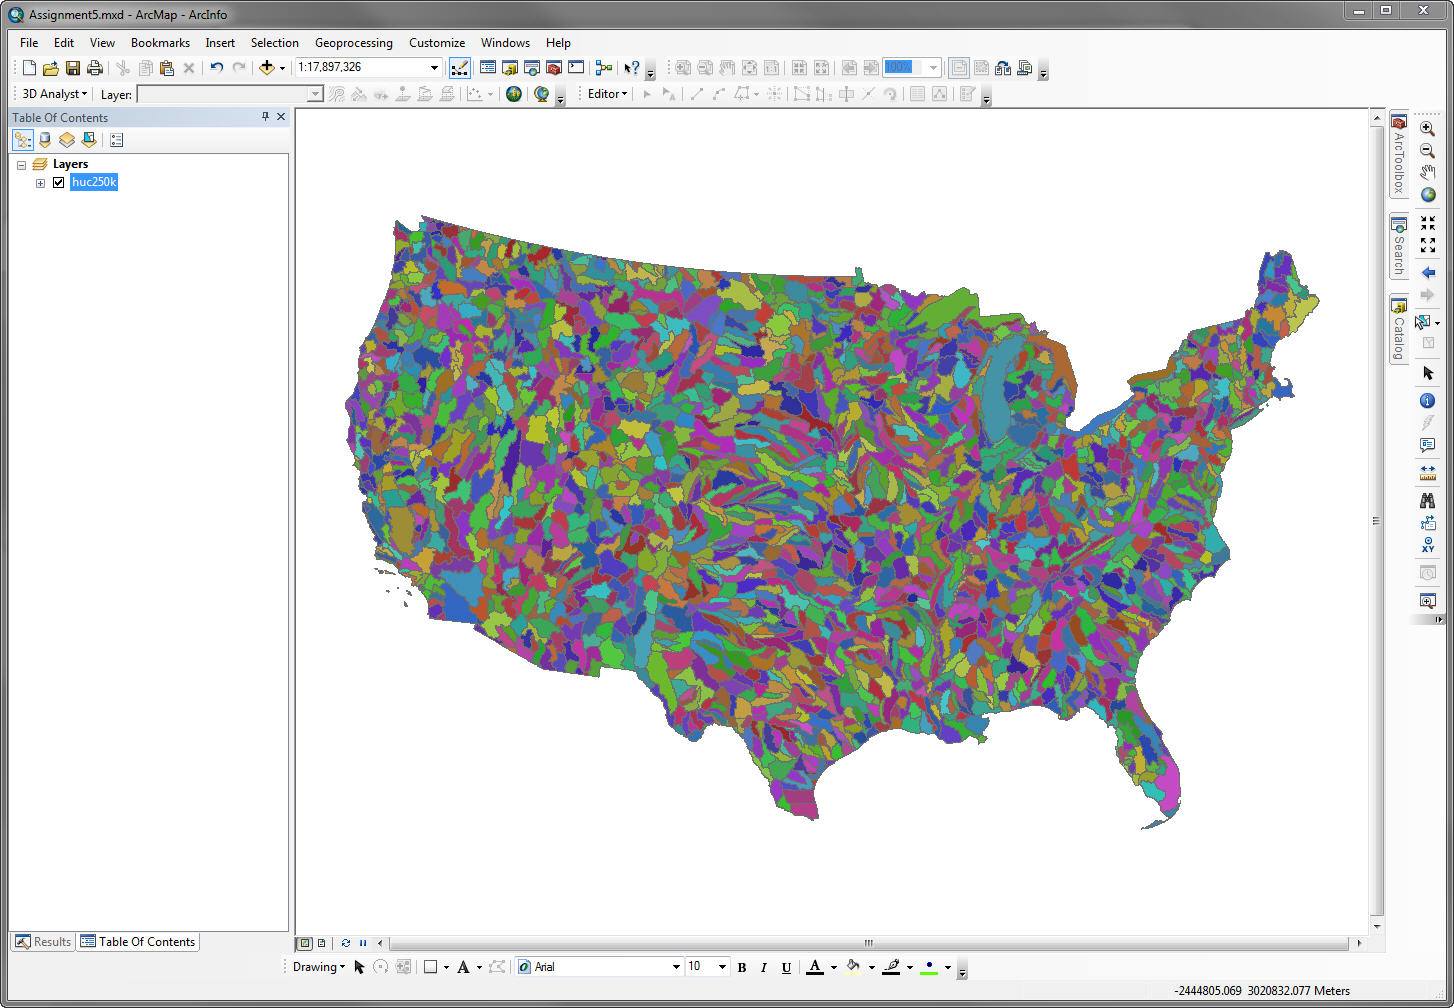
c) Add national dataset: Add HUC250k layer to new map.
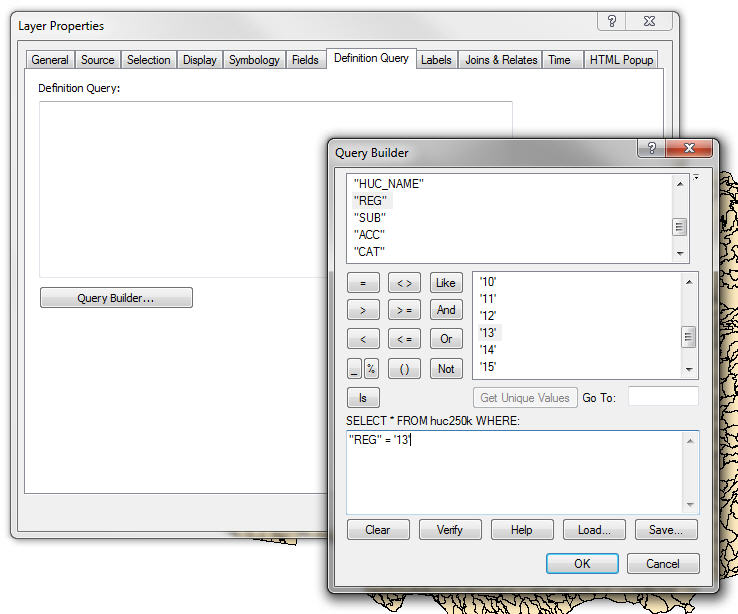
d) Select regional basin: Right click layer > Properties... > Definition Query > Query Builder...
Enter "REG" = '13' Its a good idea to use the attribute list, operators, and Get Unique Values to assist with formatting of the query.
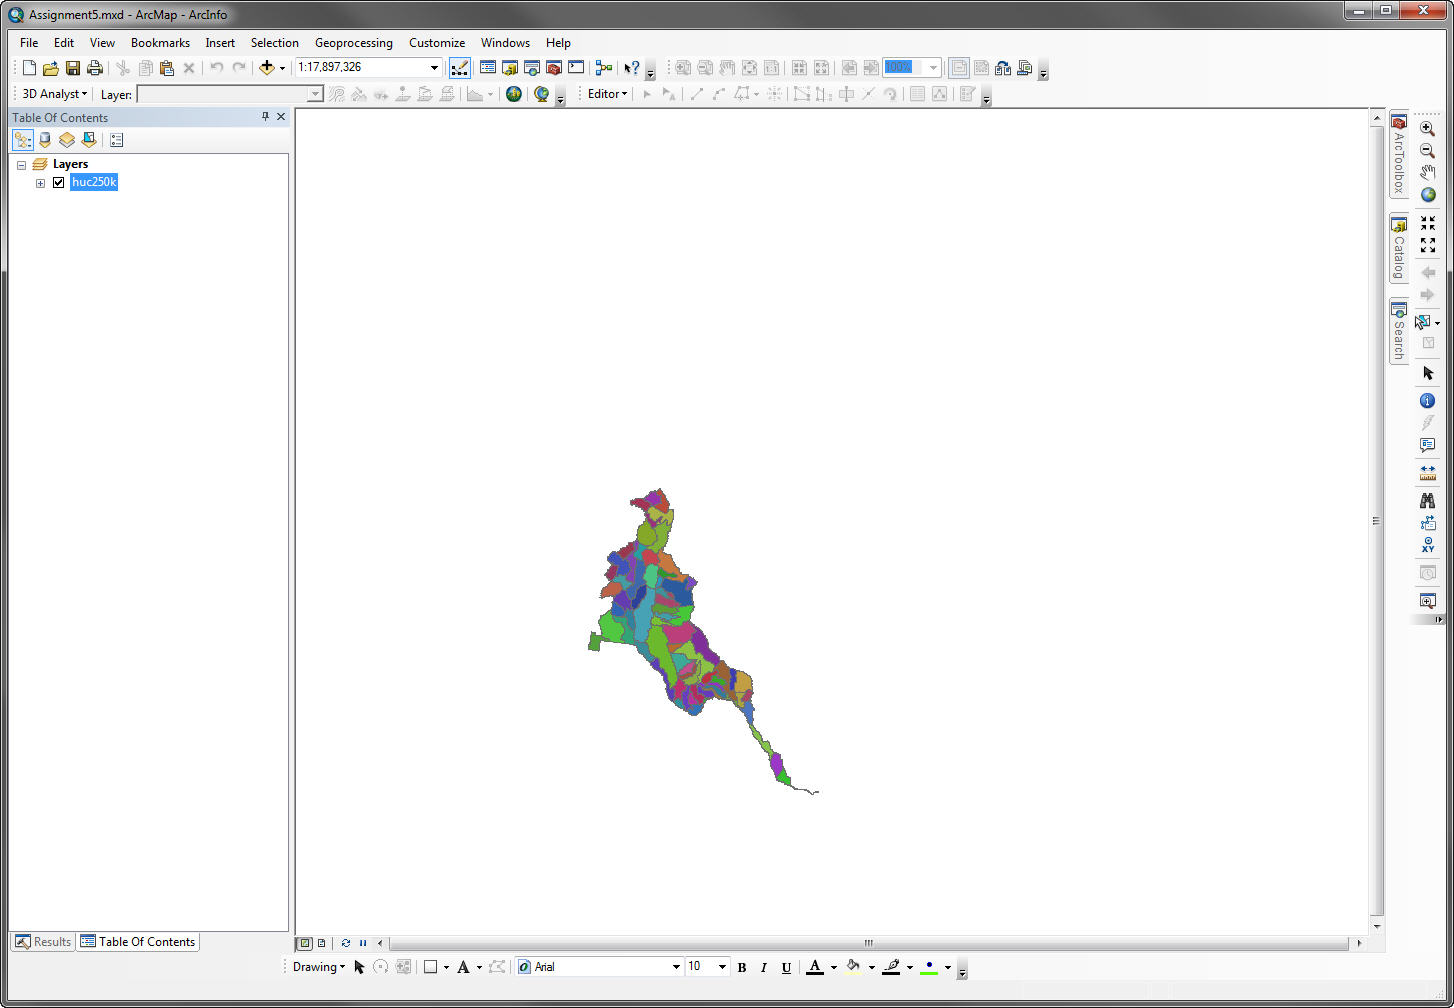
You have now isolated the Rio Grande basin.
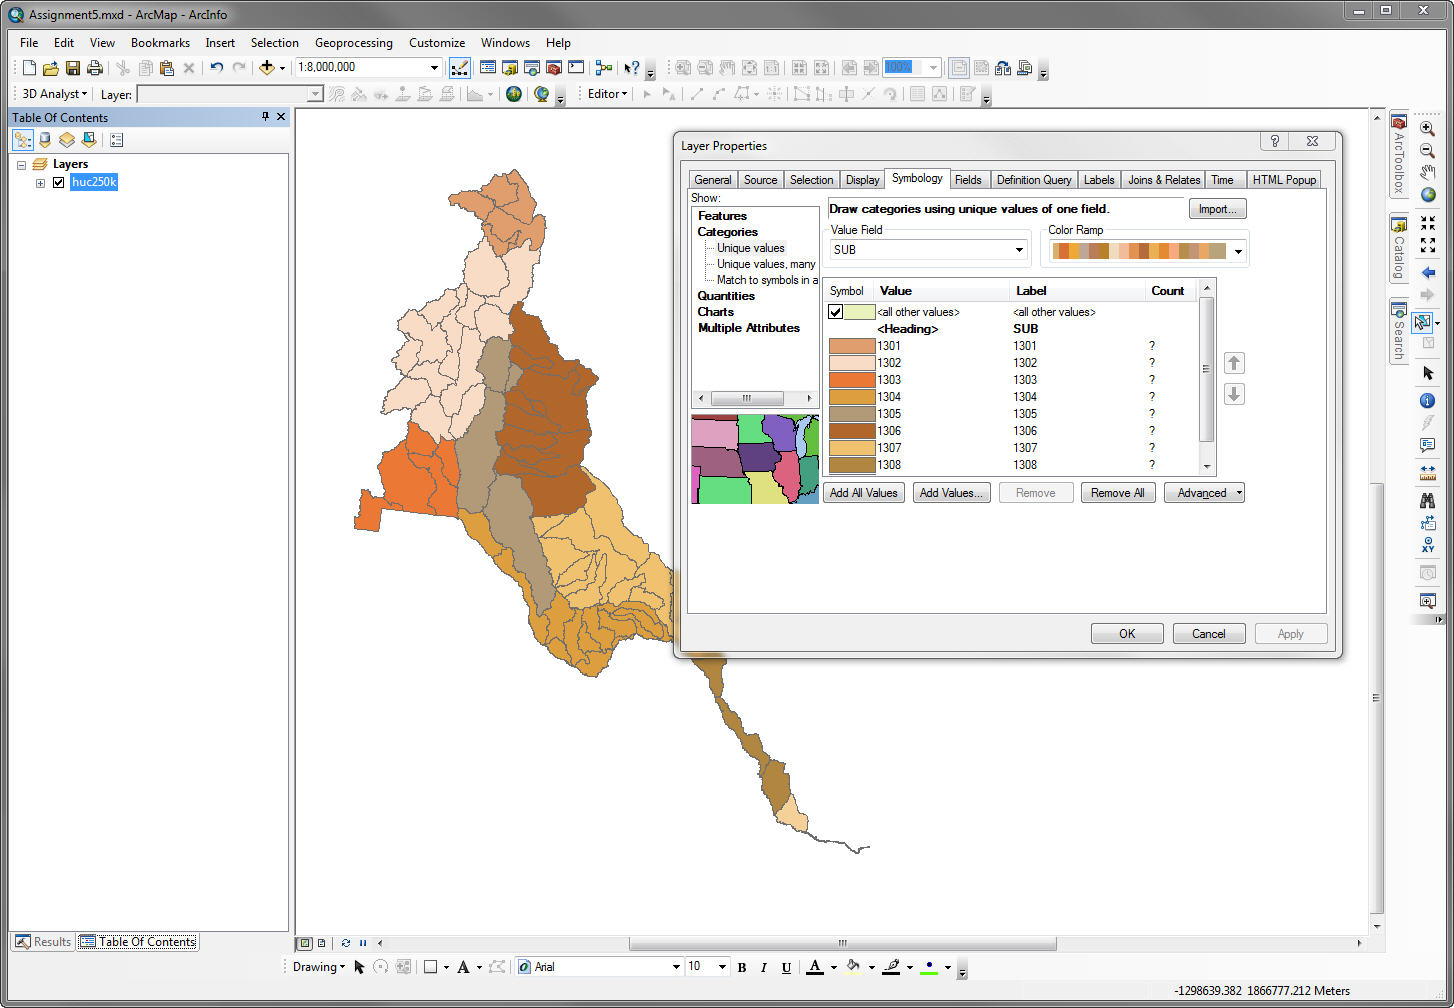
e) Change symbology: Go into symbology and choose an attractive color scheme for your basin. The numbering system for HUCs begins with 2 digit designation for large areas (ex: 13 for Rio Grande) and increases to 12 digits for small sub-basins. The smallest sub-basin in this dataset are 8 digit HUC (ex: 13060001, Pecos headwaters). You can see these listed in the SUB, REG, ACC, and CAT attributes.
f) Add additional data: Add the Streams and Reservoirs layers to your map.
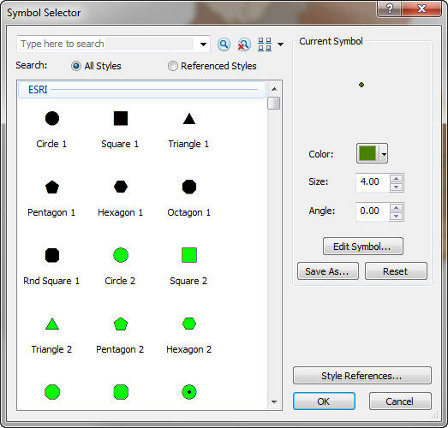
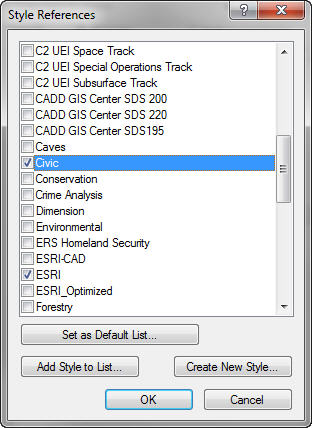
g) Expand symbol types: In the Symbol Selector you can change the default icon to something visually relevant for the Reservoirs. Dozens of icon sets are available under Style References...

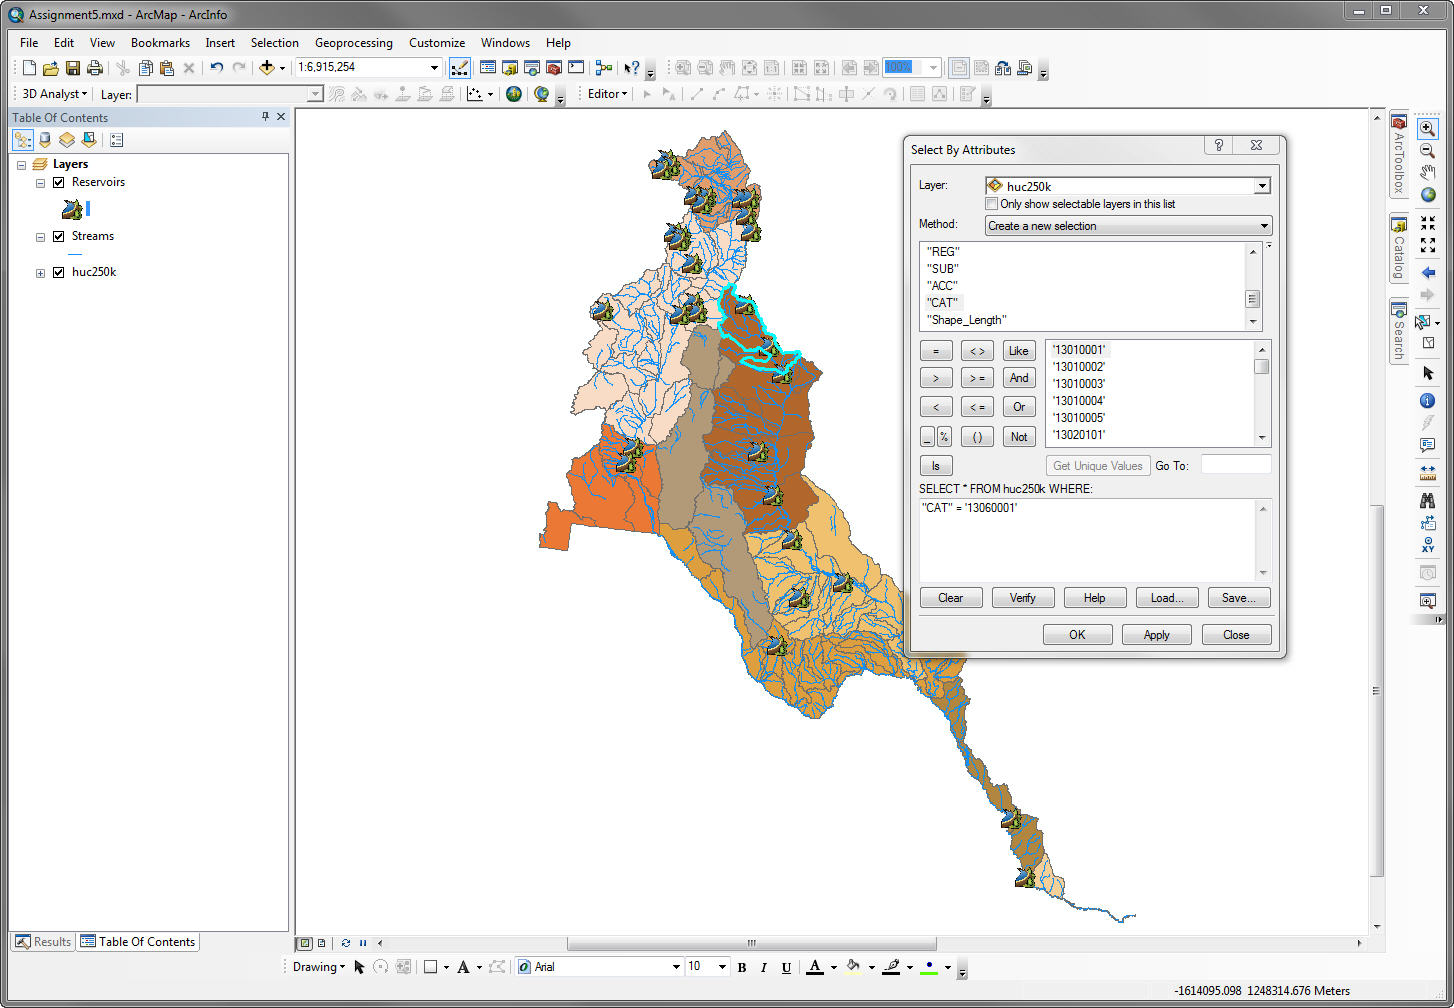
h) Select specific sub-basin: Go into Selection > Select By Attributes and use the query “CAT” = '13060001 to select the headwaters of the Rio Pecos.
i) Export data: Right click on the huc250k layer > Data > Export Data... to save the selection to a new shapefile. When asked, add new layer to existing map.
j) Select streams and reservoirs: Now go to Selection > Select by Location...
The Select by Location tool allows selection of features in many different ways. Select features from your Streams and Reservoirs layers that are completely within the PecosHUC layer.
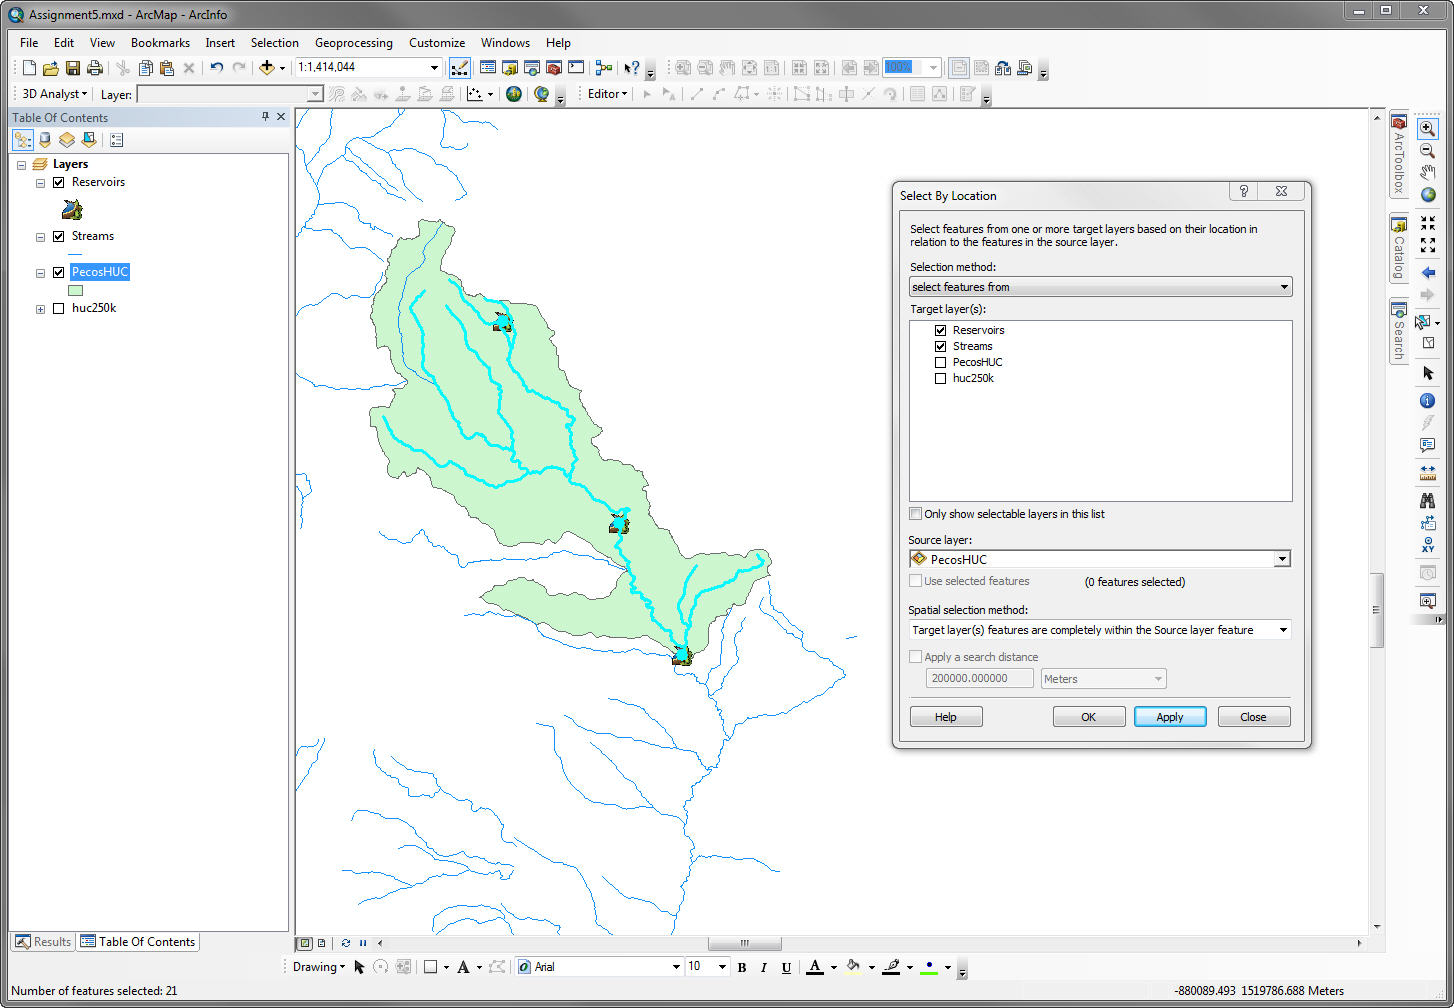
Click Apply. Did you select all the feature you expected?
Note that the furthest upstream portion of the Pecos River was not selected. Play with the "Select By Location". Is there a way to have this upper stream included in the selection?
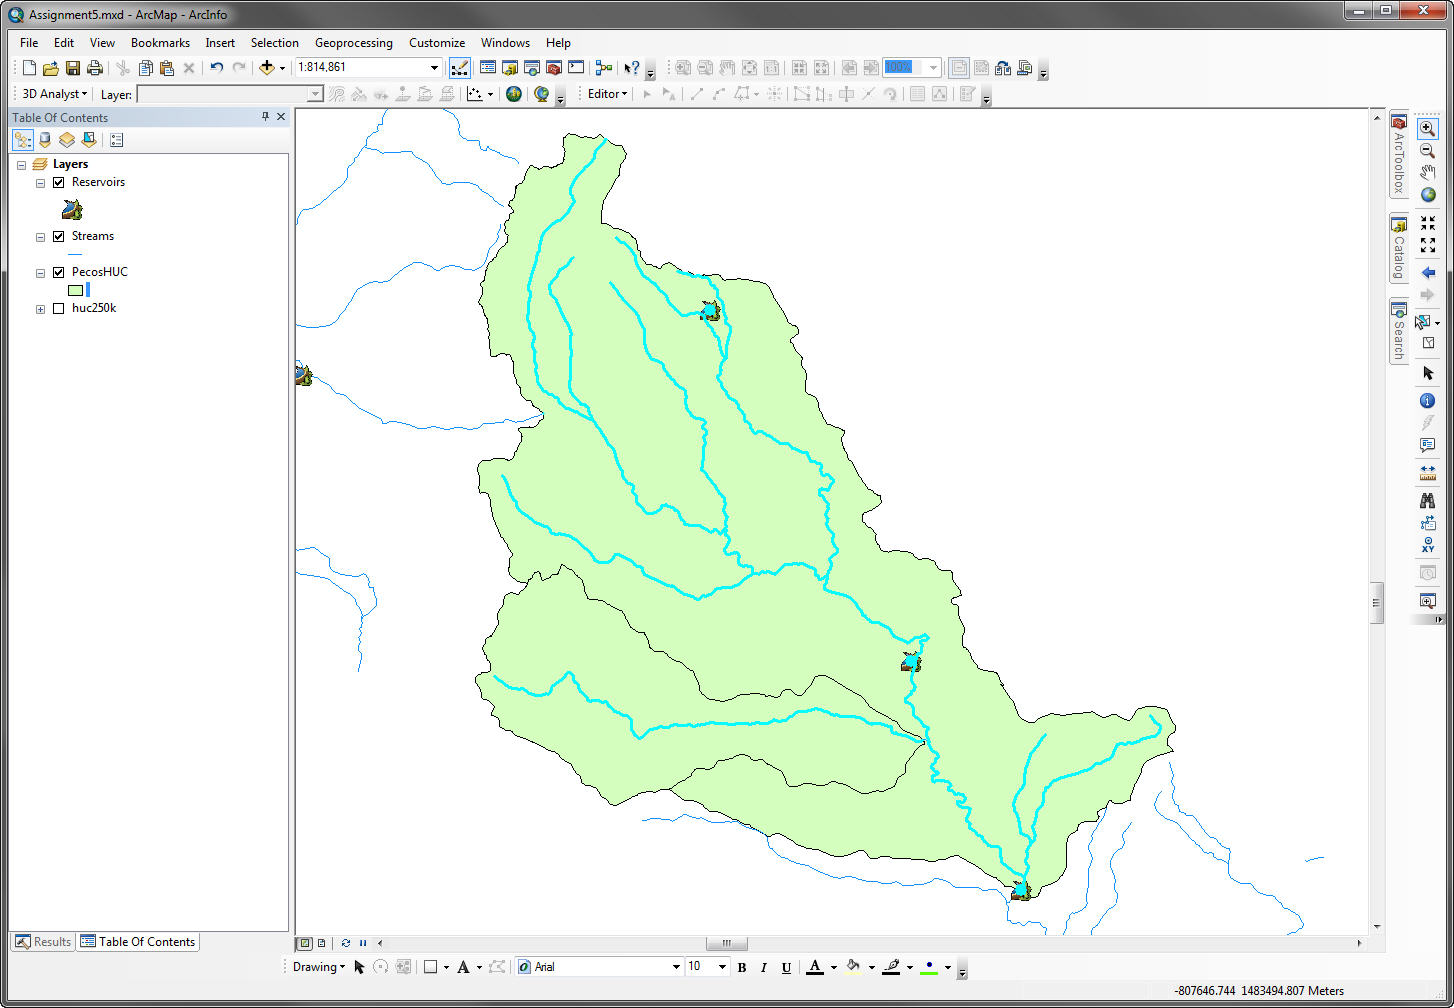
Also note that the PecosHUC does not include the entire watershed above Ft. Sumner Lake. The Selection tools allow connecting search strings with AND/OR to refine your query. The Pintada Arroyo watershed is HUC 13060002. Go back and create a new shapefile that includes both 13060001 and 13060002. You can overwrite your previous PecosHUC shapefile.
Going back and adding a new basin may seem like busy work but it is common to revise a basin area as you look more closely at the river network.
I managed to select the upper part of the Pecos
River but couldn't do it with Select By Location. Explore the
Selection pull-down menu until you are able to select the rivers.
The Select Tool ![]() may also be helpful. Export your stream network to a new
layer.
may also be helpful. Export your stream network to a new
layer.
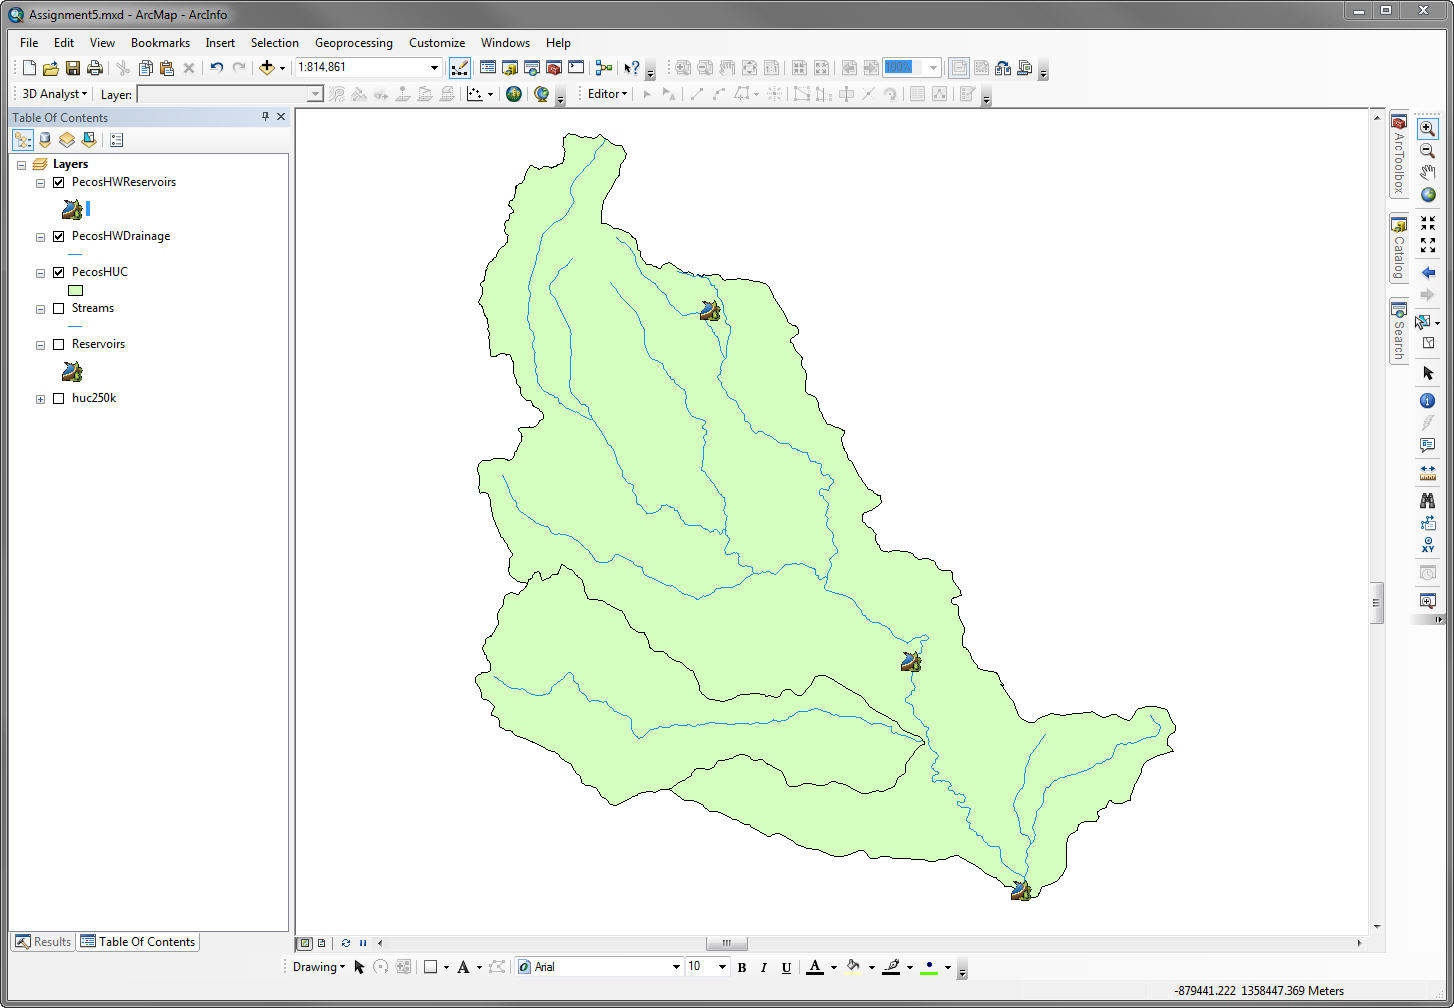
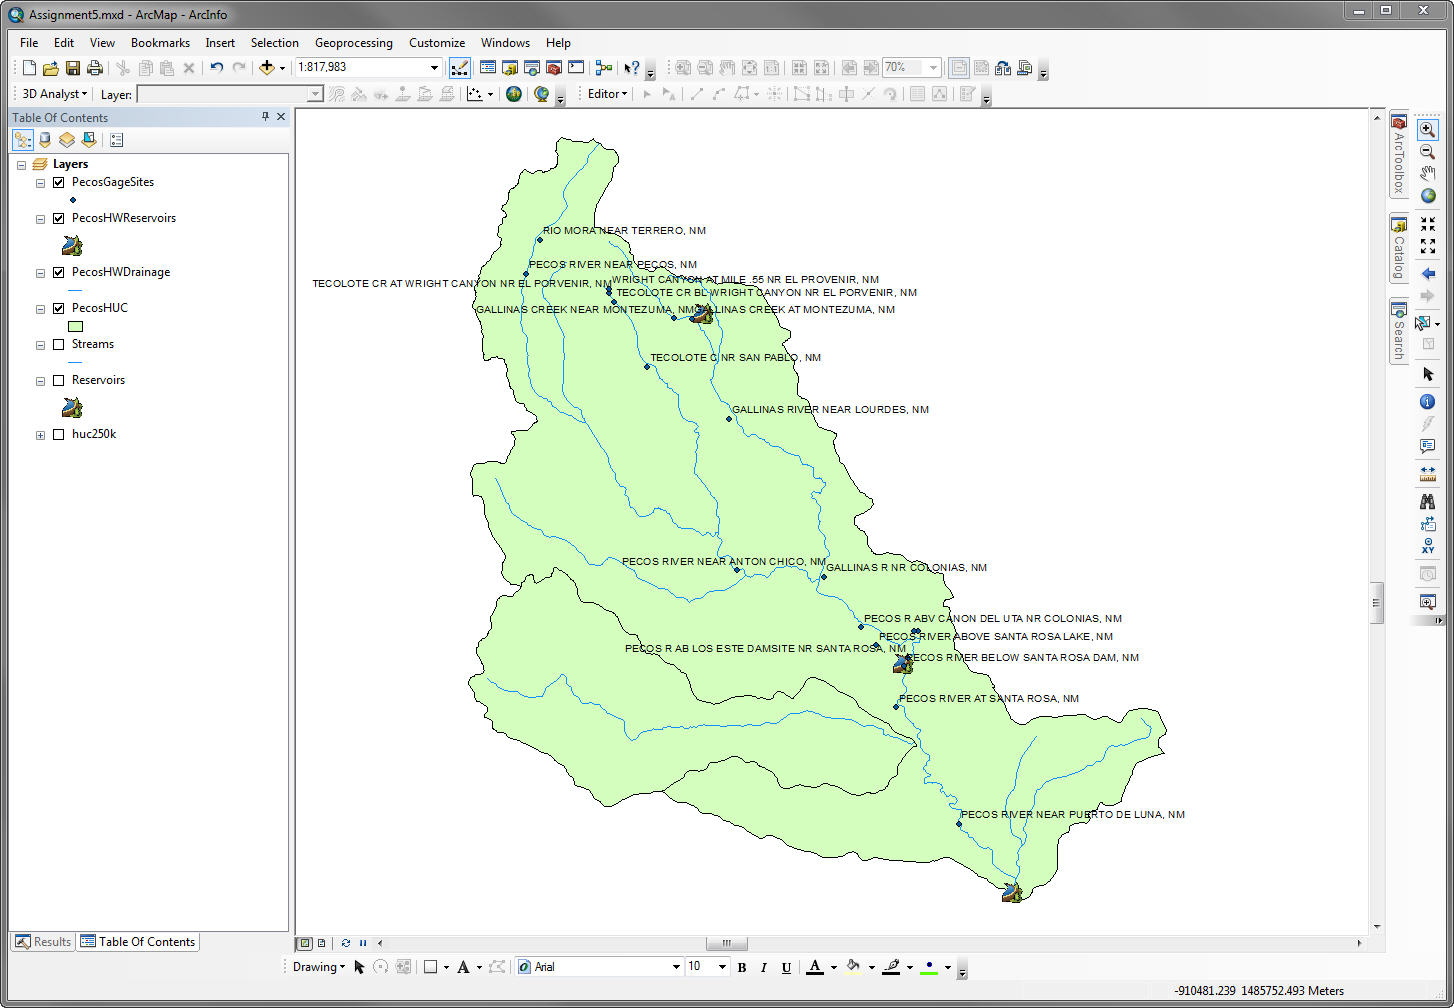
Here's the entire Pecos headwaters with new layers for stream network and reservoirs:
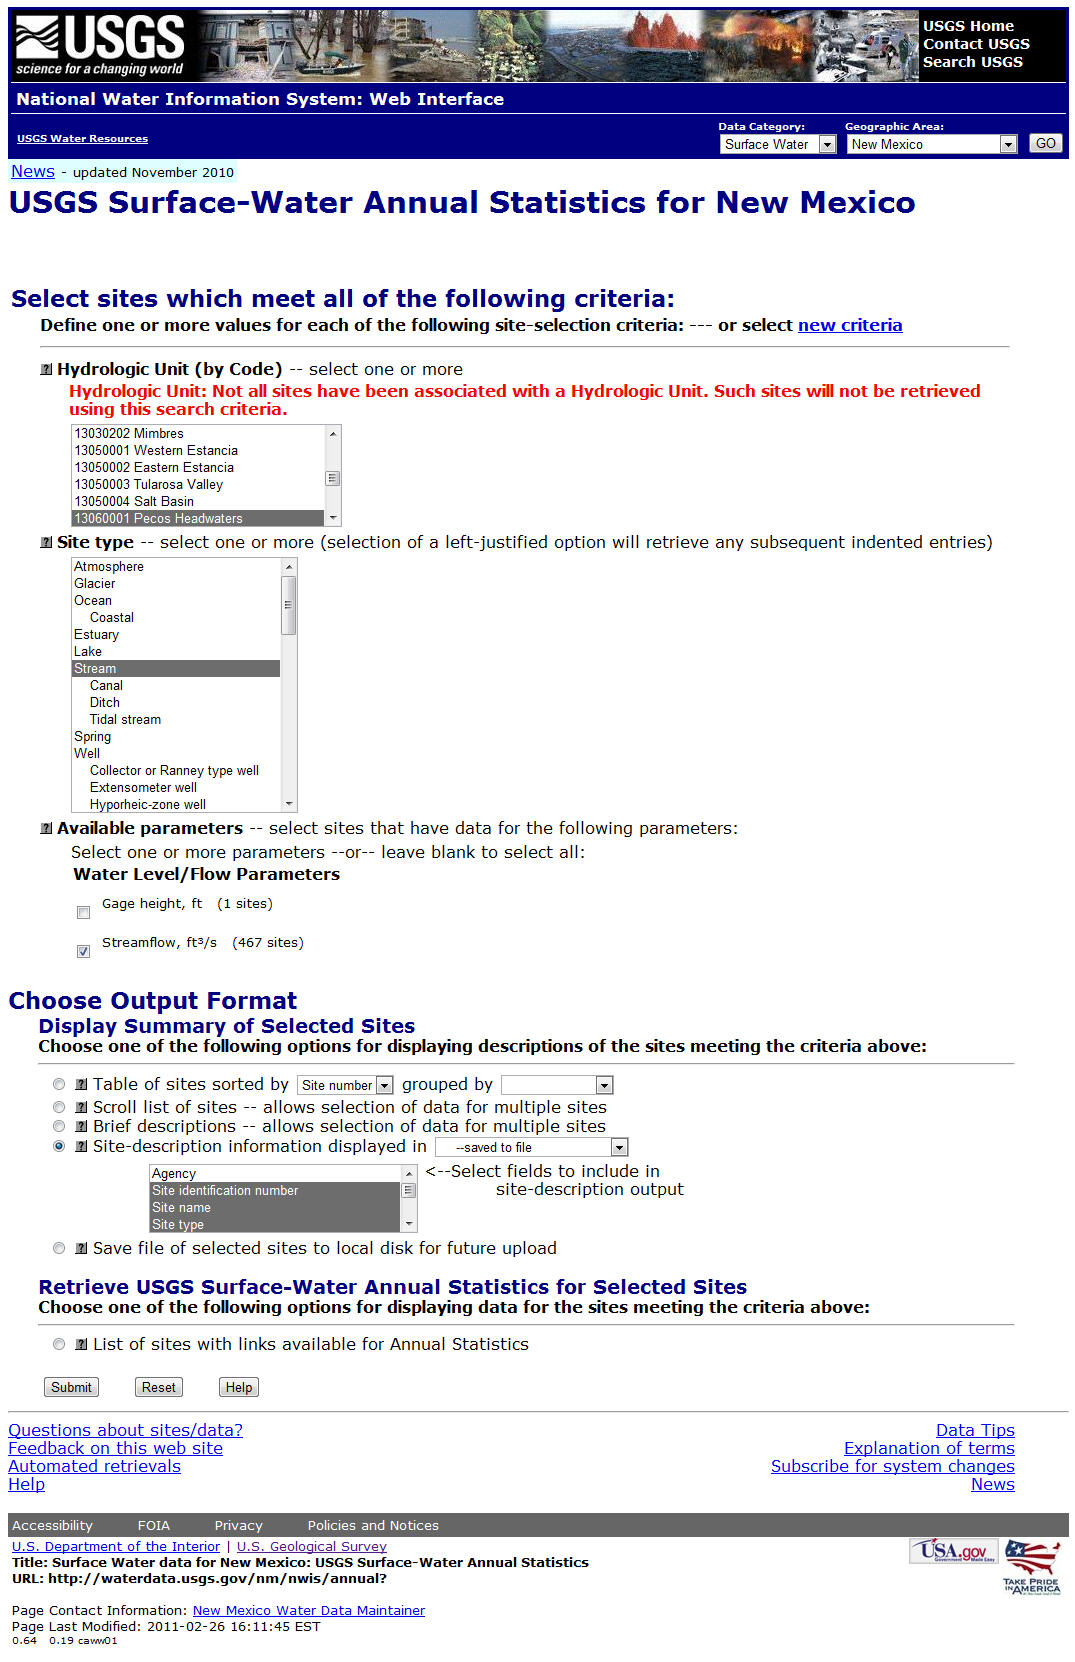
The USGS is a tremendous resource for flow data. The web address for the Water Resources Division of the USGS in New Mexico is: http://nm.water.usgs.gov/.
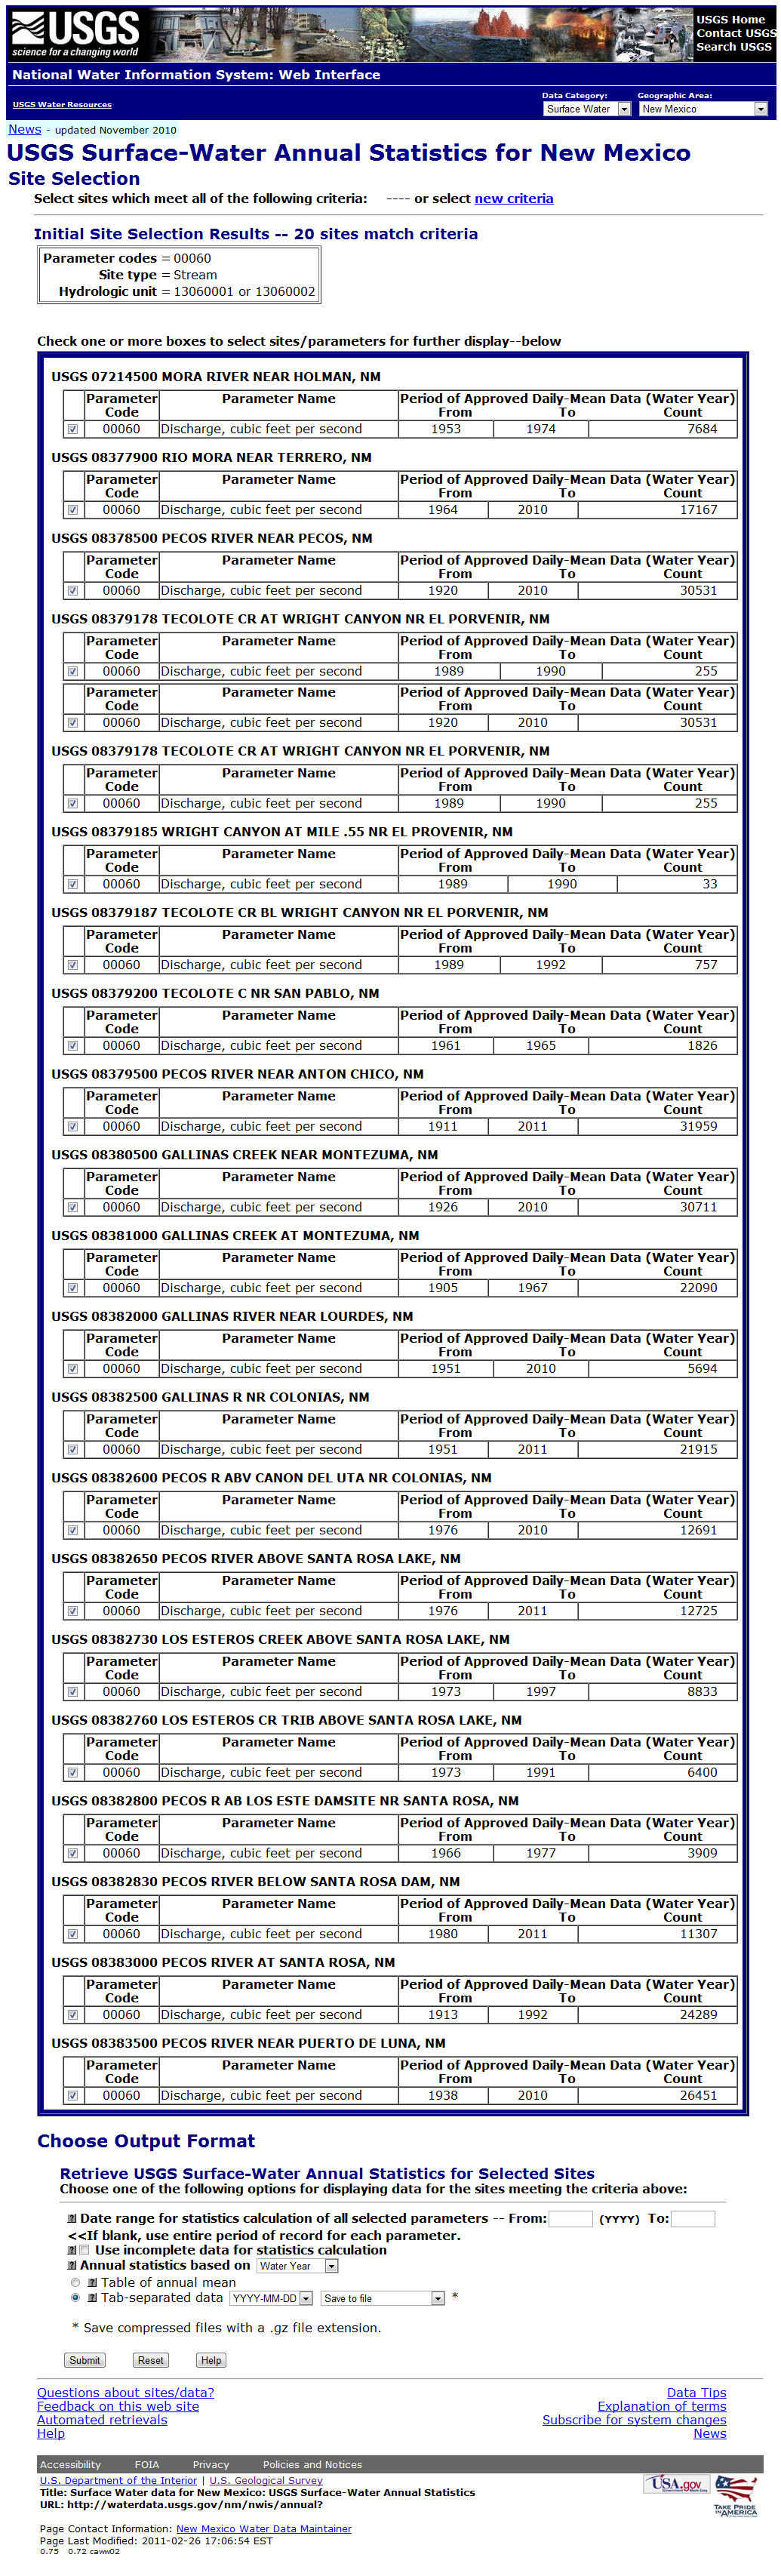
a) Download spatial data: Go to the USGS web page and choose Historical Data > Streamflow and then Annual. Set the Site Selection Criteria to Hydrologic Unit (by Code). Click Submit. On the next screen, you'll be able to select 13060001 and 13060002 as the hydrologic units. Select 'Stream' as the site type and 'Streamflow' as an available parameter. You can display a summary of your selected sites several different ways. Choose 'Site-description information...' Select fields for your table by pressing the control key so that you can select multiple fields under "Select fields to include in site-description output". Make sure that you select number, name, decimal latitude, decimal longitude, altitude, and datums. Click Submit. Save the file as PecosHWSites.txt
b) Download temporal data: Additionally, at the bottom of the same webpage you can choose "Retrieve USGS Surface-Water Annual Statistics for Selected Sites" The next webpage will bring up site selection allowing the requested data for multiple sites within the watershed (including discharge data dating back in some cases to 1905!). Click check boxes next to all sites, leave date range empty to get all data from gages, and download a Tab-separated file. Name the file PecosHWData.txt
c) Preparing data for import: Open the PecosHWSites.txt file in Excel. You will see a file similar to this:
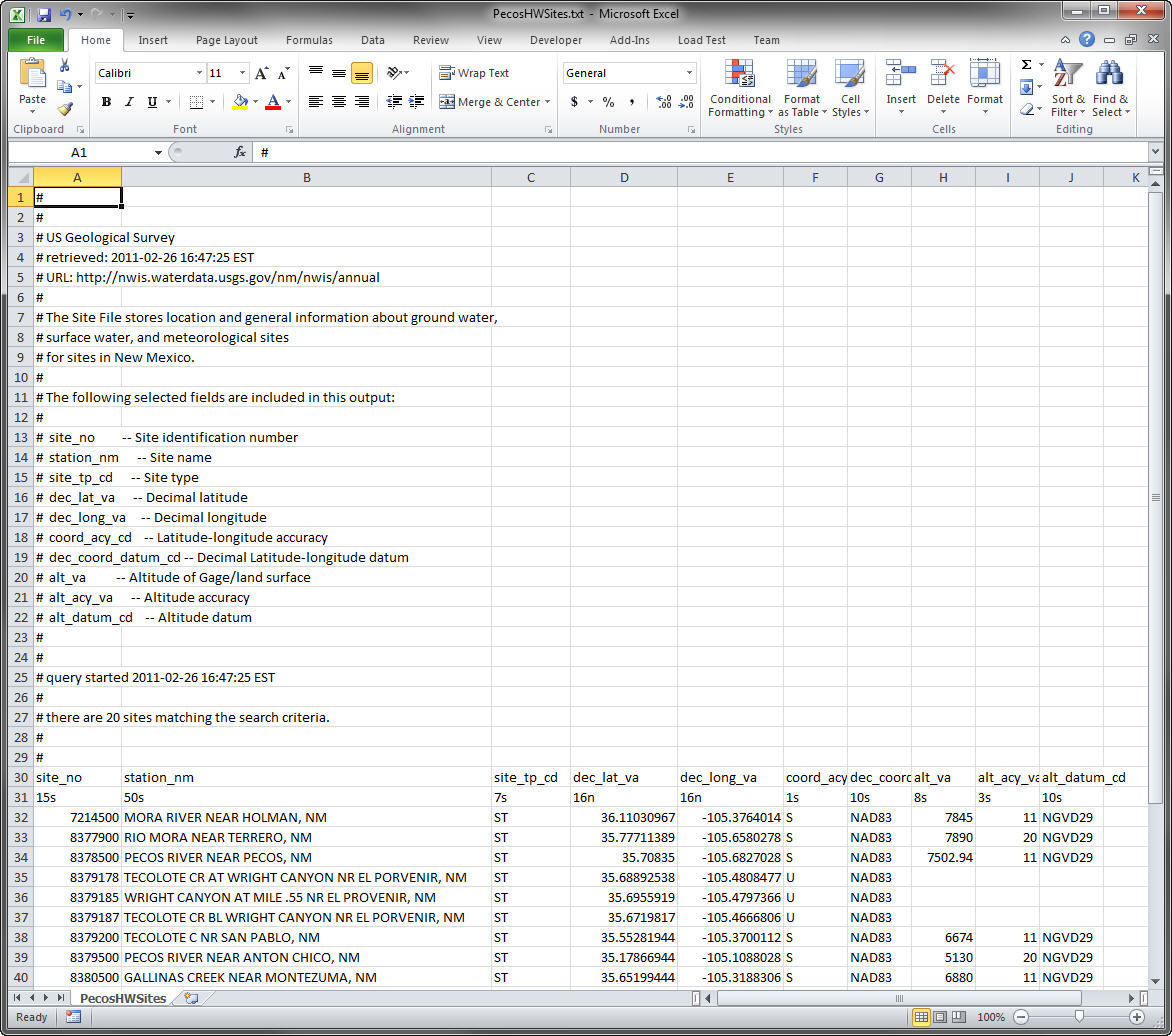
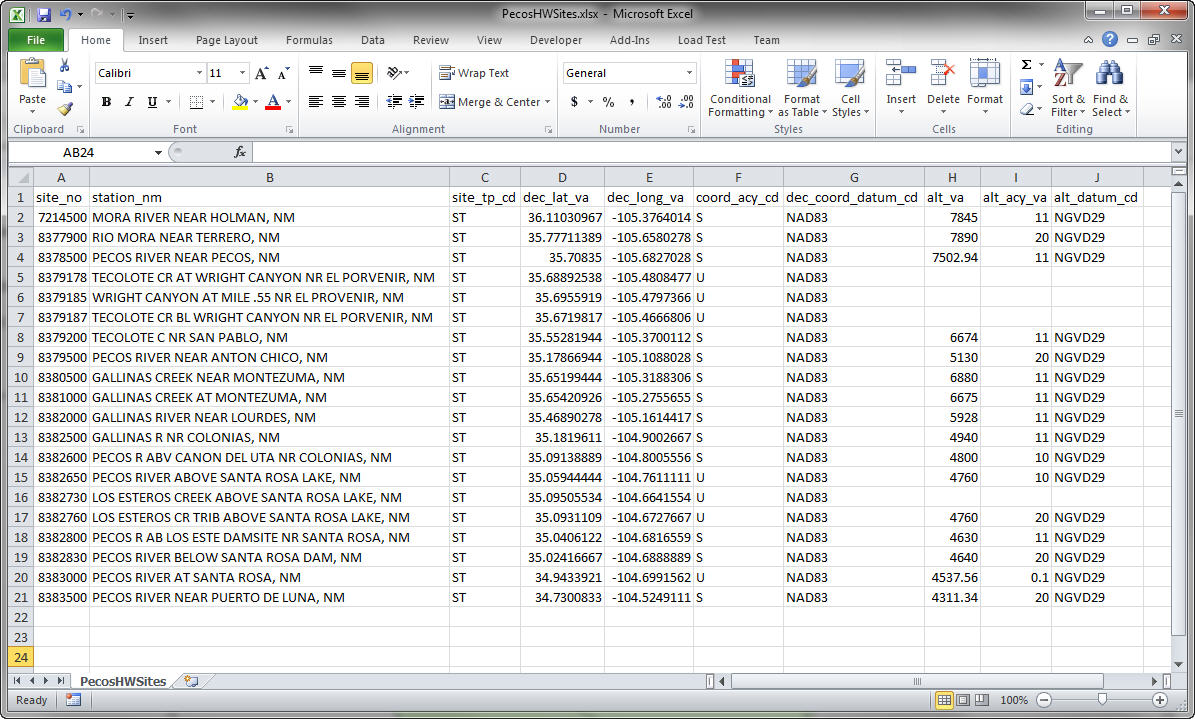
ArcGIS doesn't like headers on XY data so all the rows above the column names must be removed. In addition, the row below with column names must be deleted. Once your cleaned up the file save it as an xls (Excel) document. Before you leave Excel, keep in mind that ArcGIS will look at this as a database rather than a spreadsheet. In other words, columns are viewed as fields that have been formatted according to type. Excel often defauts to a 'general' format. Select each field and format according to the data in the field. (Do not select a range of cells - think like a database and select the field (entire column)). Note: In some instances, ArcGIS seems more compatible with older versions of Excel.
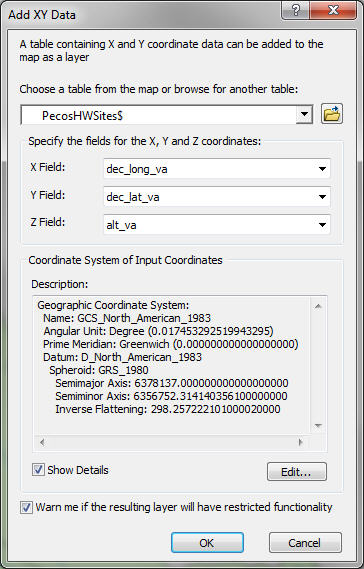
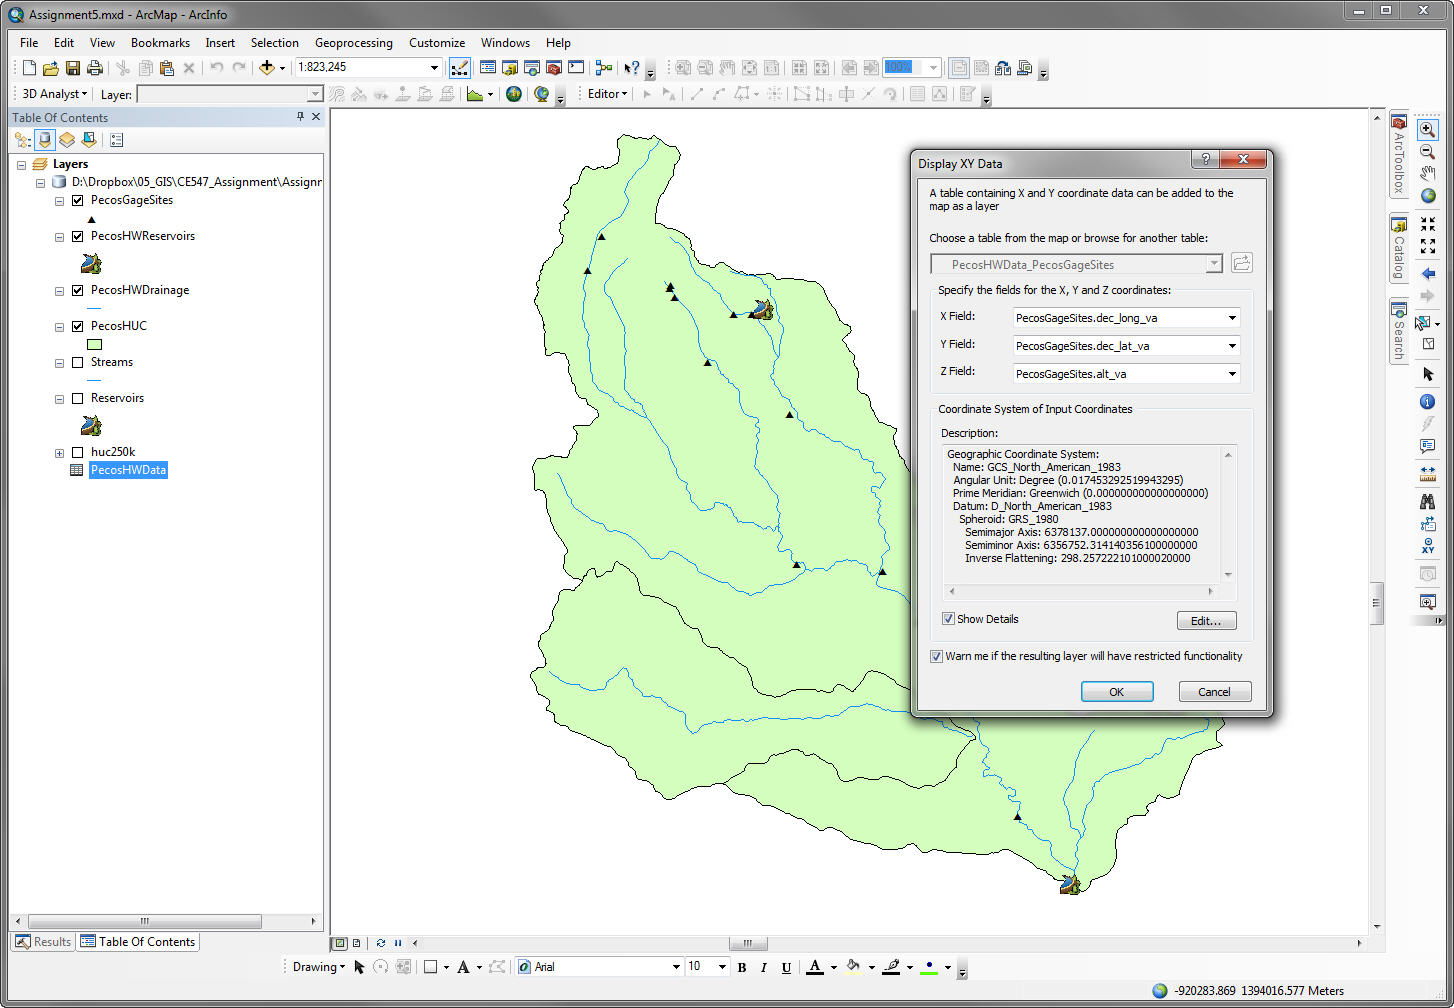
d) Import into ArcGIS: Back in ArcMap, go to File > Add Data > Add XY Data... Select your new xls file and fill in the proper columns from the drop down menus. The projection needs to be changed to match the value specified in the download. (In the dialogue box below, you need to select the Edit button to change the Coordinate System of Input Coordinates.) Why is this so important? Note that if you look at the Data Frame Properties, Coordinate System tab, you will see that you are working in an Albers projection where coordinates are very large values. The coordinates of the gage data are goegraphic (latitude, longitude). If you don't tell the software otherwise, it will assume that these coordinates are the same as the data frame and place them a world away from the basin.
e) Save data to gdb: The gage locations should now show in your map, with "$ Events" added to the layer name. Export the data from this layer to create new shapefile. Add labels and export a finished map for your website.
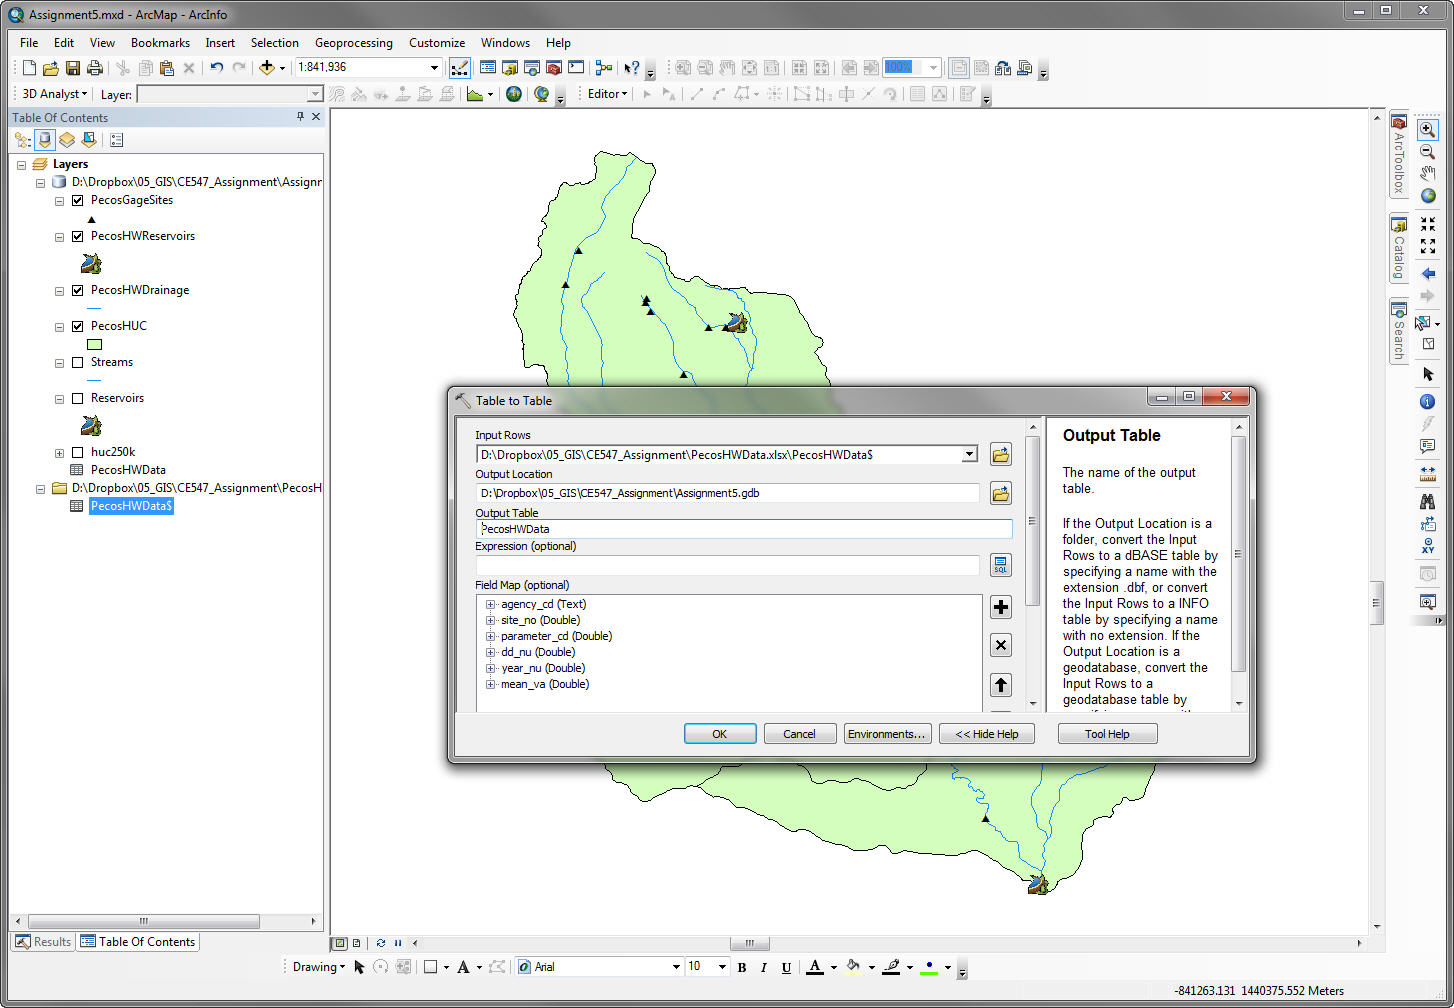
a) Add temporal data: Right click on your geodatabase and select Import > Table (Single)... Navigate to your PecosHWData.xls file, select the proper sheet, and enter an Output Table name. After a minute or so the temporal data will be added to your geodatabase and appear in your Layers list.
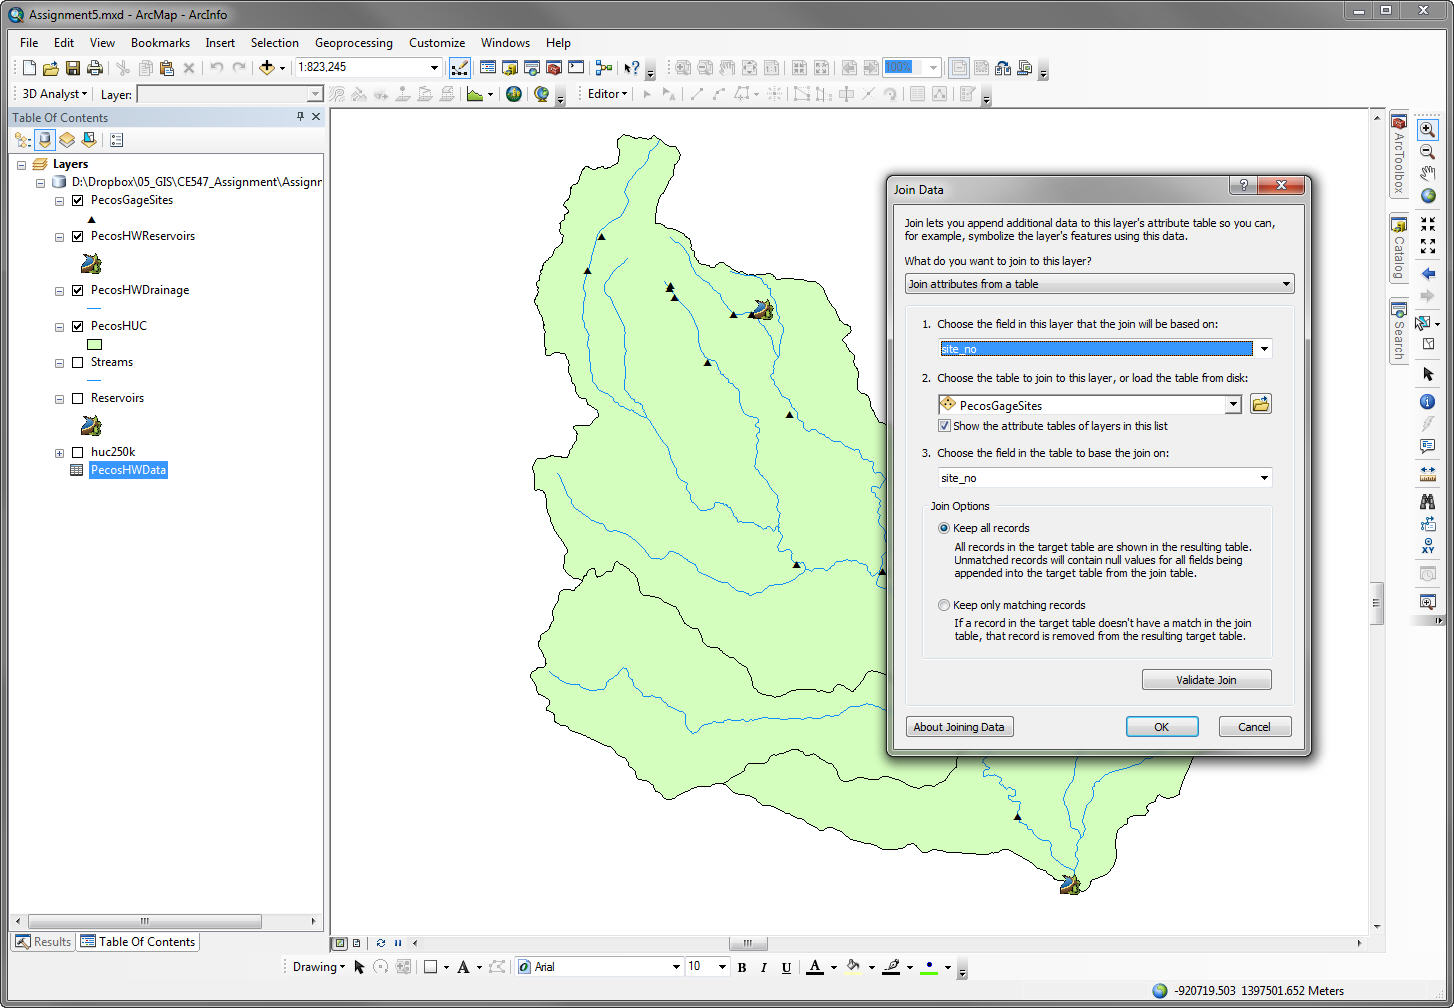
b) Join with spatial data: Right click newly added layer go to Joins and Relates > Join...
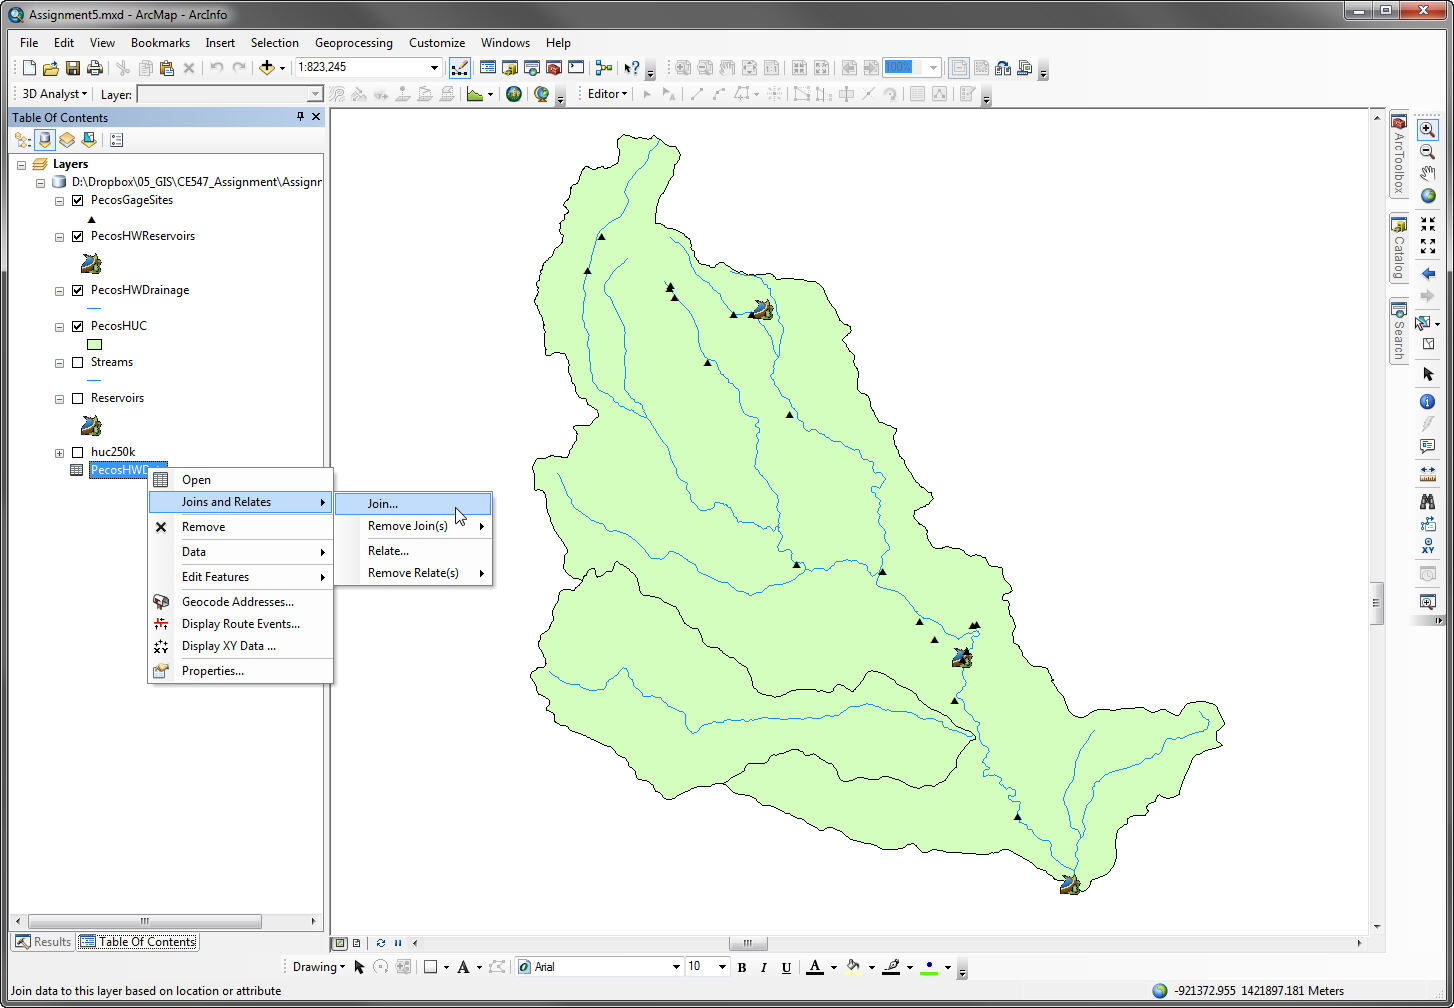
Join to your Pecos gage shapefile you created previously.
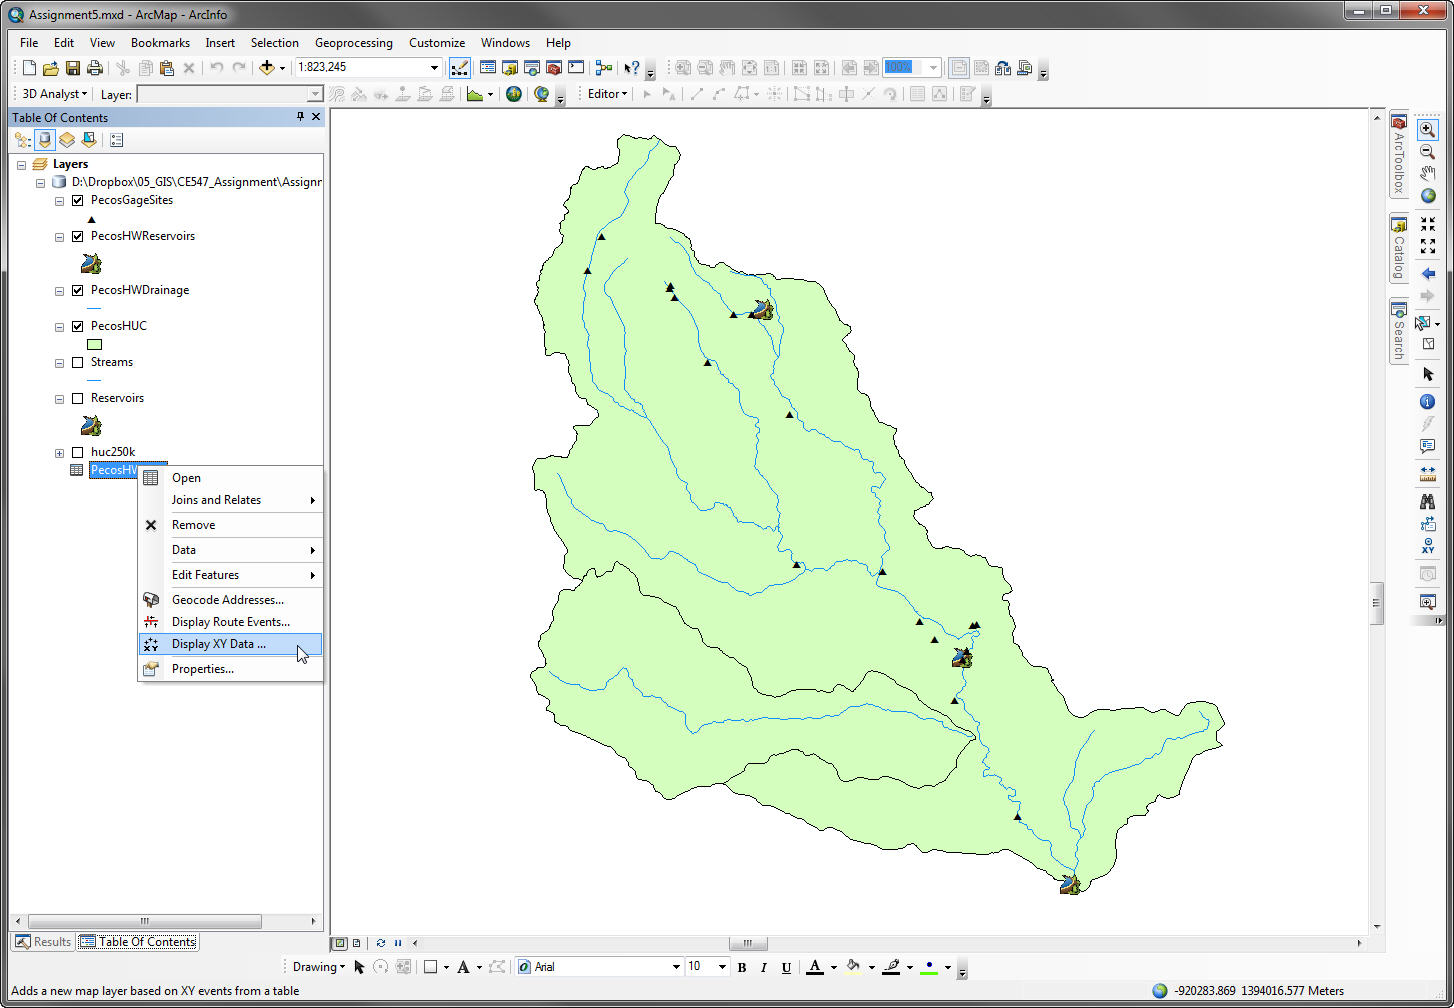
c) Display temporal locations: Right click Data layer and Display XY Data... Follow the same procedure as adding spatial data.
d) Save data to gdb: Export the newly added layer in your Layers palette as PecosHWDischarge and add the new shapefile to your map. Remove the other two gage shapefiles.
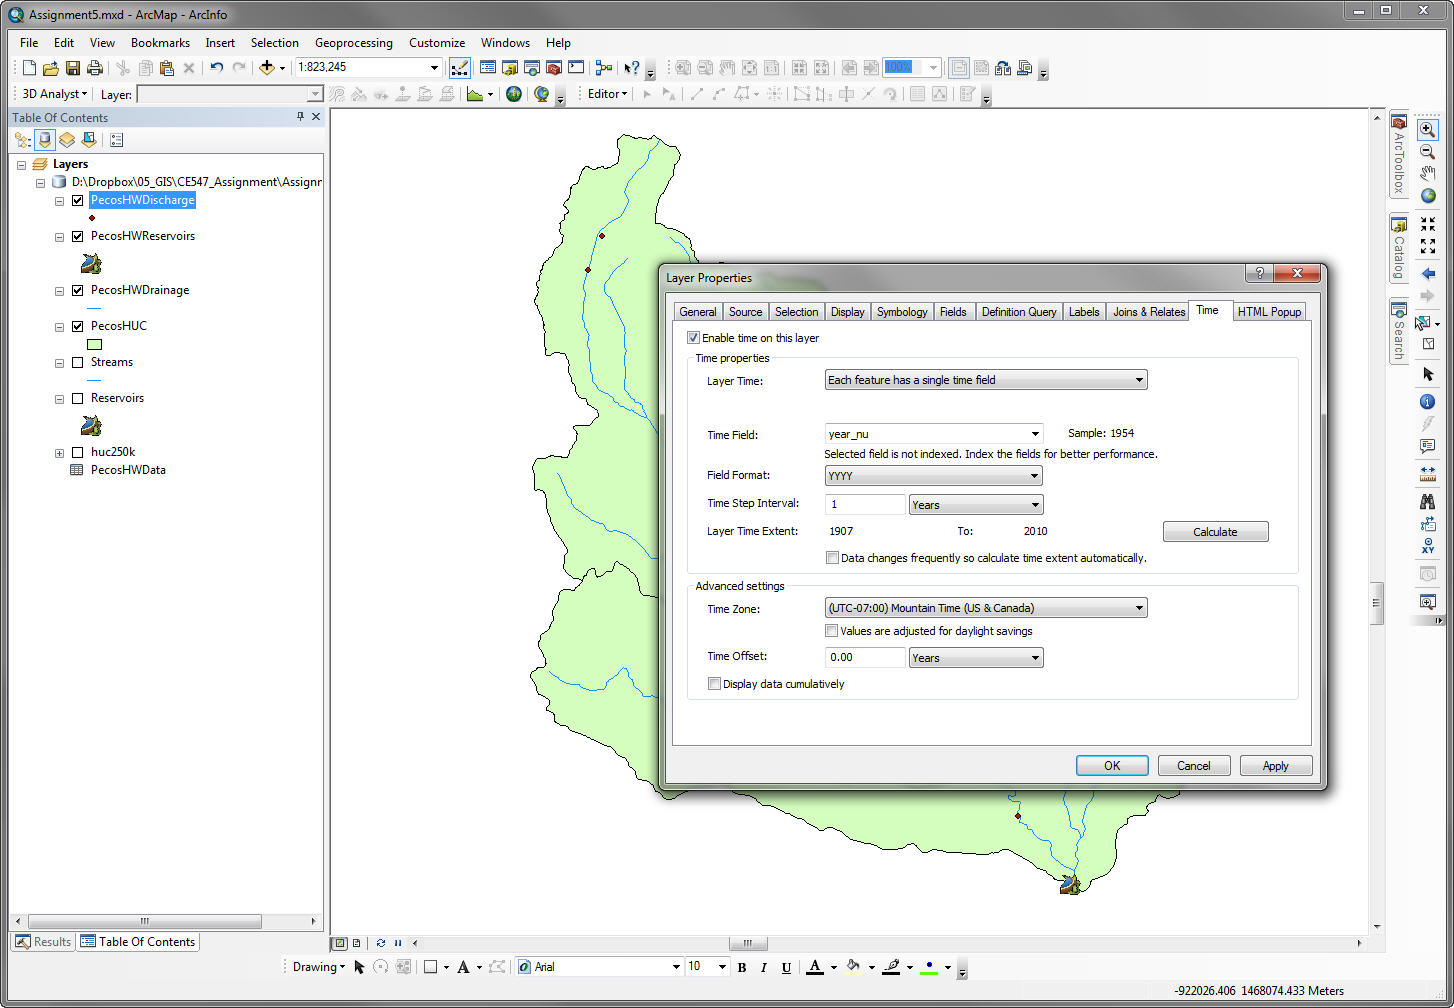
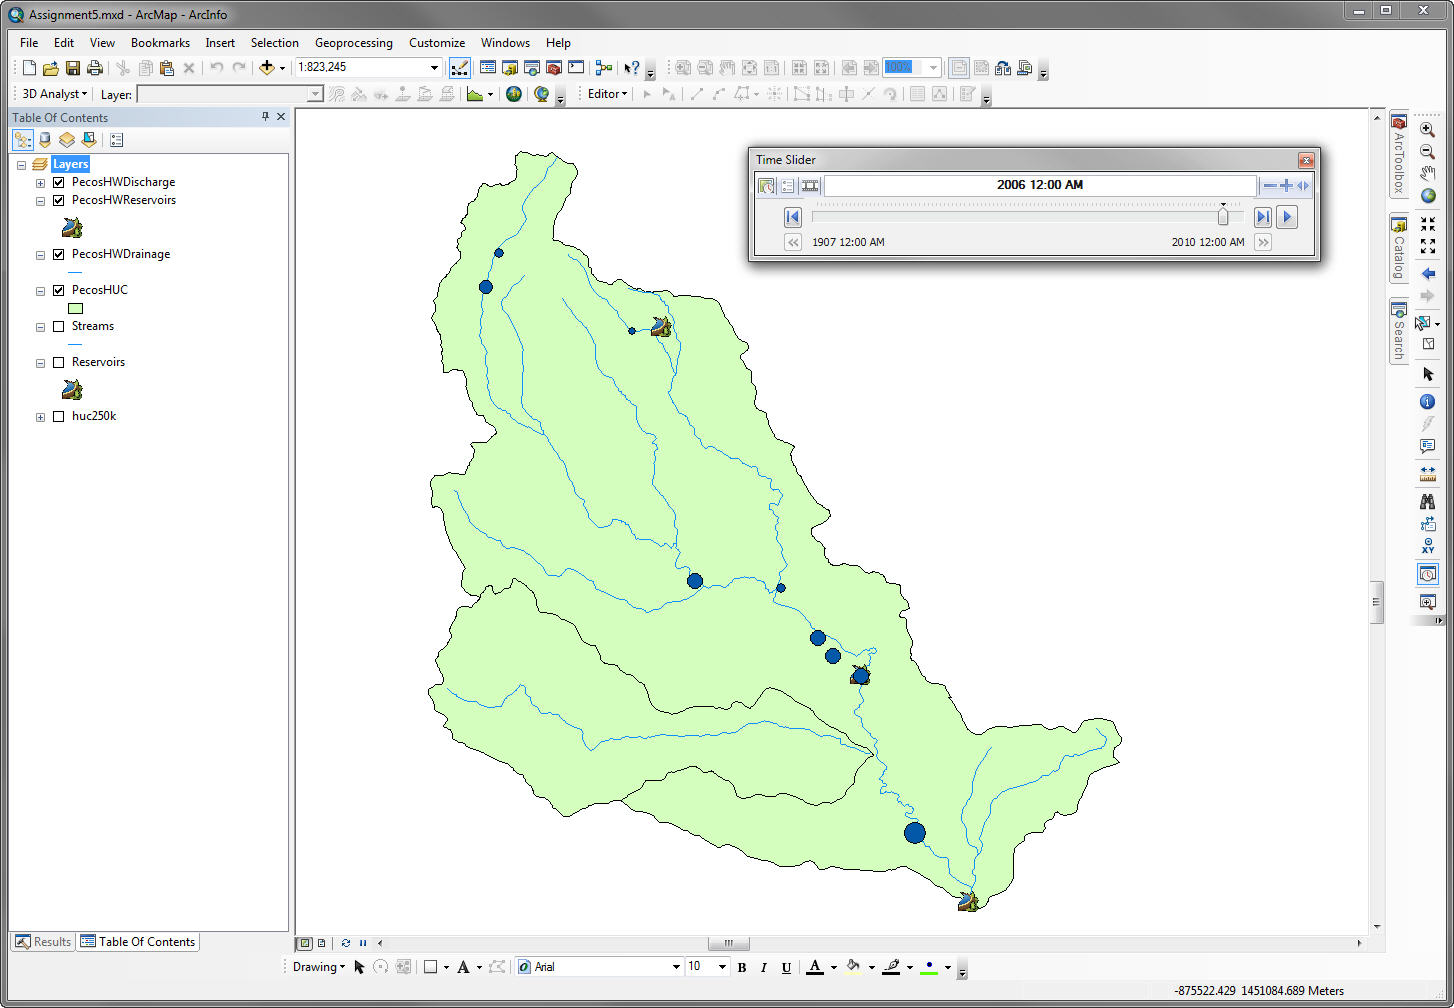
e) Activate time viewing: Open Layer Properties for PecosHWDischarge. Click the Time tab and enter values as below:
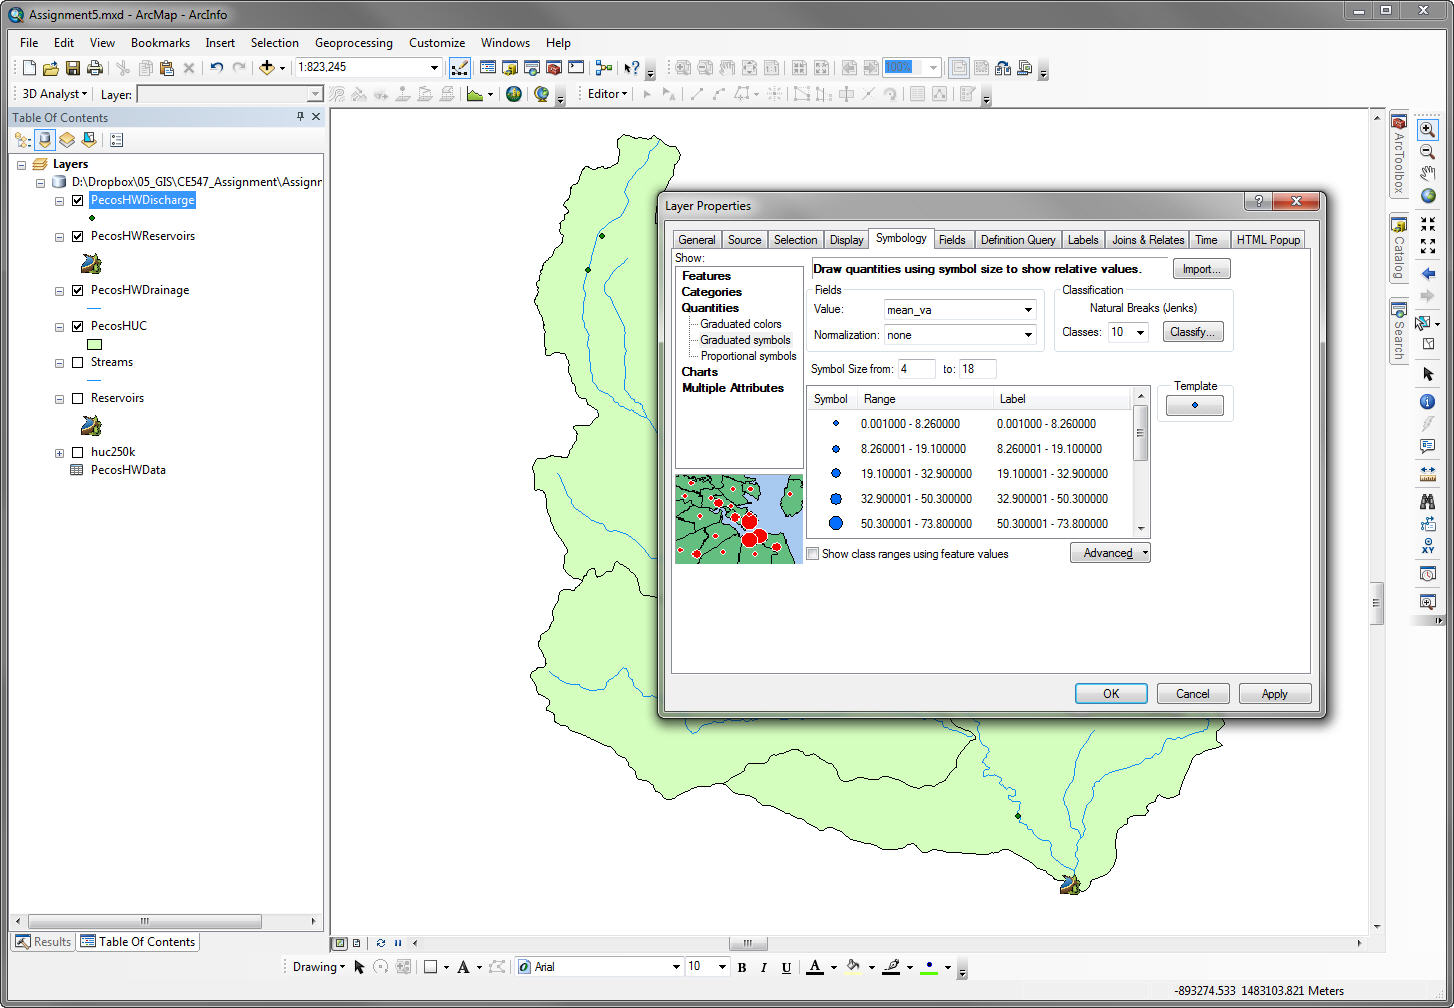
f) Change symbology: On the symbology tab, change to Graduated symbols with a value of mean_va. This will show changing symbol sizes as the discharge varies. Have fun experimenting with different symbologies. Labeling different features produces varying results too.
g) Play animation: Click the Time Slider Tool
![]() and play with the settings for displaying the animation.
and play with the settings for displaying the animation.
This demo just scratches the surface of animation with maps. A detailed video covering time in ArcGIS 10 is available from the 2010 ESRI User Conference. Lots of data types change with time and a short animation can go a long way in showing an audience a dynamic aspect of your research.
One more assignment done!