© The University of New Mexico, Albuquerque, NM 87131, (505) 277-0111

This Assignment is designed to expose you to map projections and coordinate systems.
a) New Geodatabase
(gdb): Open the ArcCatalog tab and navigate to the location you want to save Assignment 3.
You may need to use the Connect to Folder icon
 to access your USB key. Right click on your folder and select New > File Geodatabase. Enter a descriptive name.
When saving files to a geodatabase on your USB key it makes managing your project files much easier. For these assignments try keeping your ArcGIS MXD file in the same folder as your geodatabase. Many experienced GIS users progress to having several gdbs with commonly used shapefiles and rasters they share between many maps.
b) Add Data to your geodatabase: Navigate to C:\Program Files (x86)\ArcGIS\Desktop10.0\TemplateData\TemplateData.gdb. There are lots of data to explore here for both the USA and the World. Double click either to see the layers that are available. Hold down the Control Key to select more data layers at a time.
Data management trick: Open the ArcCatalog tab and navigate to the folder with TemplateData.gdb and open the folder with your project geodatabase. Click the different layers in the TemplateData to see a preview of the file (Click 'Show next view' if you don't see a preview). When you find layers you like, drag them to your geodatabase. You will now have a copy to take with you. Make sure to use your copy when creating your map. (Screenshot)
Note: Drag and drop only works between gdbs. To add a regular shape file, right click in the database and use the import menu.
c) New Map: Follow instruction from Assignment 2 for setting up a new map. Don't forget to set the 'Document Properties' to "Store relative pathnames to data sources" and change the Default Geodatabase location to your newly created database.

d) Change the Data Frame Projections: Go to View > Data Frame Properties... and select the Coordinate System tab. Experiment with different applying different world projections. More information on projections is available in Chapter 13 of the green book and on ESRI's website.
When the above layers were first added the coordinated system is GCS_WGS_1984 (Geocentric Coordinate System World Geodetic Survey 1984). Applying World Goode Homolosine Land and a bit of layout yields the following finished map:

a) Add Data: Create New Data Frame. Add U.S. States and U.S. Cities.
b) Show capital cities: Right click the cities layer to access the layer properties. Select the Definition Query tab. Select the Query Builder button. In the Query Builder Box, you will build a query. Double click “CAPITAL” under the Fields list. Then single click =. Click 'Get Unique Values' then double click “Y”. Select the 'Verify' button, if the query passes, click OK, If not, clear the query and begin again.
Many queries can be proformed within Query Builder. For example, you could use the query builder to see cities with populations greater than one million using “POP1990” > 1,000,000. Queries can be combined with AND/OR to isolate only the results of interest.

c) Display cities based on population: Access the Layer Properties by right clicking on the layer name. Click the Symbology tab. Under Show: select Quantities>Proportional symbols. Under the Fields box, change the Value to POP1990. I chose to show three symbols in the legend. You can change the color of the symbols by double clicking the box with the Min Value symbol. You may click Apply to see if the view looks like you want before you click OK.

d) Label cities: Let’s zoom in on the contiguous 48 states and label the cities by right clicking the layer and selecting label features. Let’s also change the name of the layer to Capital Cities. Access the Layer Properties and select the General tab to change the name of the layer.
e) Measure distance: Use the Windows pull-down menu to access the
Magnifier. Place
the Magnified window over Olympia, Washington. Next,
we’re going to measure the distance from Olympia to Augusta, Maine. Select
the measure tool. and
then click Olympia. Use
the mouse to highlight the bar on the top of the magnification
window. Move
the window so that it is centered above Augusta. Once
the window is centered above Augusta, you can double click Augusta
to end the measuring sequence.
and
then click Olympia. Use
the mouse to highlight the bar on the top of the magnification
window. Move
the window so that it is centered above Augusta. Once
the window is centered above Augusta, you can double click Augusta
to end the measuring sequence.

In the status bar (bottom) you will note that both a segment and a total are measured. Note the units of measurement is decimal degrees.
We want to change our measurement units. Right click the name of the data frame “Layers”. Use the general tab to change the name to the United States. Change the display units to miles and re-measure the distance between Olympia and Augusta.
f) Change projection: Now let’s change from a geographic projection. Right
click the United States to access the Data Frame Properties. Click
on the Coordinate System tab. Select
the USA Albers Equal Area projection (under Continental). (If
you need more instructions, refer to Chapter 13 of the green book). Press
OK.

Re-measure the distance between cities. Note
that you may need to change the display units (General tab) if you
want miles.
g) Finding more details: Let’s determine the largest capital city and the one with the highest elevation. Open the attribute table by right clicking the layer name and selecting Open Attribute Table.
When you right-click the name of a field, you have the option to sort the table. Why do think there are several values with –99?

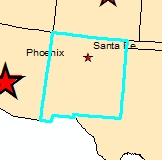
a) Select New Mexico: Use
the Select Features tool
![]() (to the right of the zoom tools) and select
New Mexico. It
should be highlighted in cyan.
(to the right of the zoom tools) and select
New Mexico. It
should be highlighted in cyan.
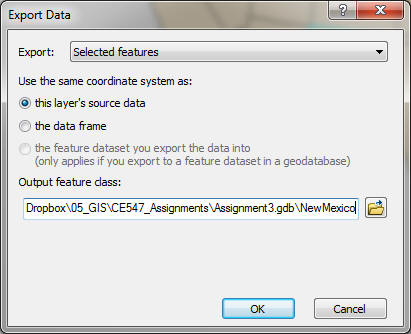
b) Save the state: Right click the states layer and choose Data > Export Data. In the Export Data box, make sure to choose your default geodatabase as the location of the export.

Export finished maps showing your World, United States, and New Mexico projections. Try to design maps that both convey useful information and are attractive for the viewer.
Examples:


