ISLETA
TO SAN ACACIA VEGETATION TRENDS
OVER
A TWENTY YEAR SPAN (’92-’12)
|
DIGITIZING |
Digitizing
The vegetated
areas were digitized from upstream to downstream. When vegetation was patchy,
areas with at least 50% vegetation were counted as fully vegetated. When
digitizing, the scale used on the aerial was 1” = 1,000’. This scale was close
enough to get the details of differing vegetation and zoomed out an adequate
amount to be time effective. Once all the areas had been digitized the total
area of all the polygons were summed and documented.
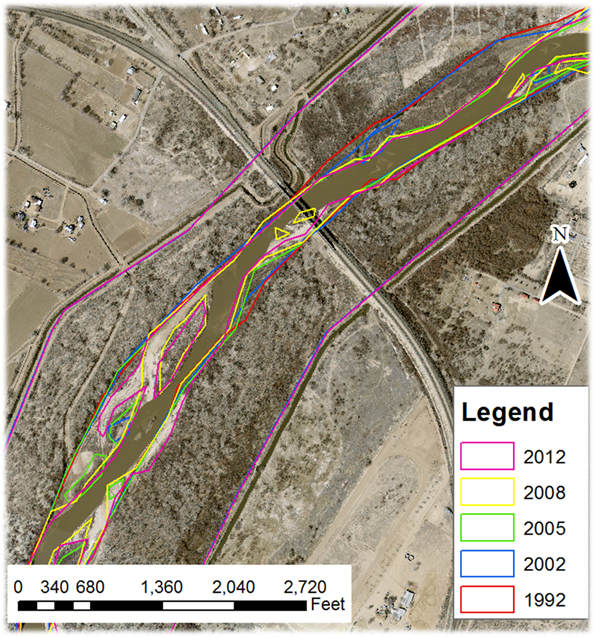
Map displaying a section of river with
vegetated areas for the different years with 2012 aerial as a background
|
DIGITIZING |
This
project completed by Tony Lampert for CE 547 at UNM in the spring of 2016