ISLETA
TO SAN ACACIA VEGETATION TRENDS
OVER
A TWENTY YEAR SPAN (’92-’12)
Results
Both methods
of calculating the area showed an increase in vegetated area. The accumulated
areas using the two methods differed widely. In 2012, digitizing resulted in
80.5% vegetated area, while image analysis resulted in 58.5%. This wide gap has
to do with the scale that the imagery was digitized along with the method used
to digitize. If the digitizing would have been done at a closer scale, there
would have been more accurate results. There was also the problem of
determining when to consider a patch vegetated or non-vegetated. Because of the
extensive area, if the area had over 50% vegetation, it was considered 100%
vegetation. With these two circumstances in mind, this same method was done for
all five of the years. They may not all be accurate but they are all
consistent.
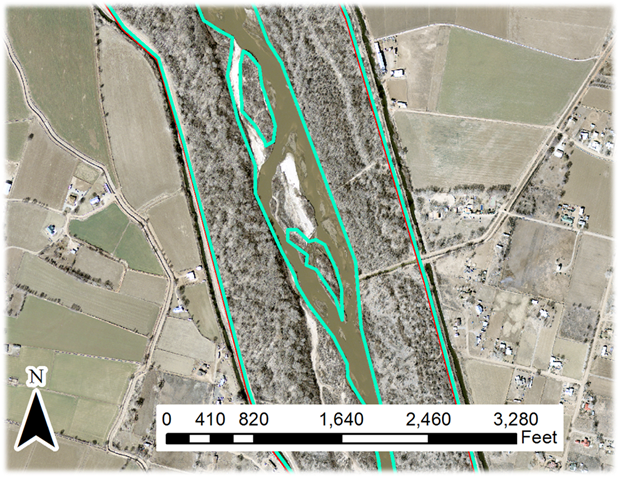
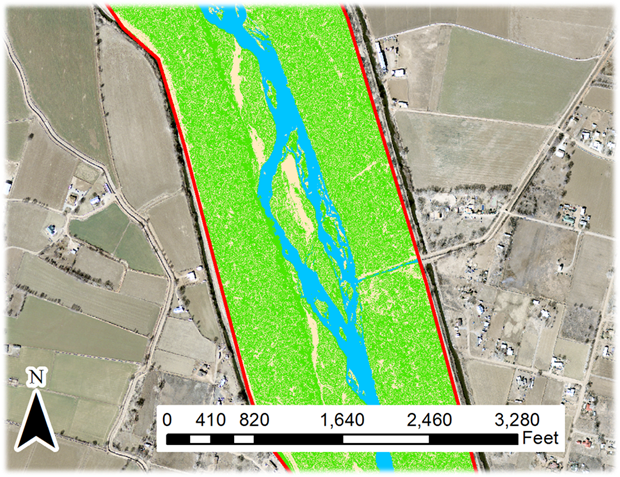
Section of river, two miles north of
Belen, NM, showing the difference in digitizing (left) and image analysis (right)
with 2012 aerial photography
Digitizing
displayed an increase of 13.7% over the twenty year span of 1992 to 2012. Image
classification presented a 7.5% increase from 2008 to 2012. When this 7.5%
increase is compared to the digitizing method for the same time period there is
a 2.4% increase. The difference in these two methods would be 5.1%. The image
classification works as a check to insure the digitizing was done precisely.
|
Image Analysis |
Digitizing |
|||||
|
Year |
Acres |
Percent |
Year |
Acres |
Percent |
|
|
1992 |
8865 |
70.8 |
2008 |
6,810 |
54.4 |
|
|
2002 |
8930 |
71.3 |
2012 |
7,330 |
58.5 |
|
|
2006 |
9610 |
76.7 |
||||
|
2008 |
9850 |
78.6 |
||||
|
2012 |
10080 |
80.5 |
||||
Amount of acres and percentage of total
12,525 acres vegetated in respective years
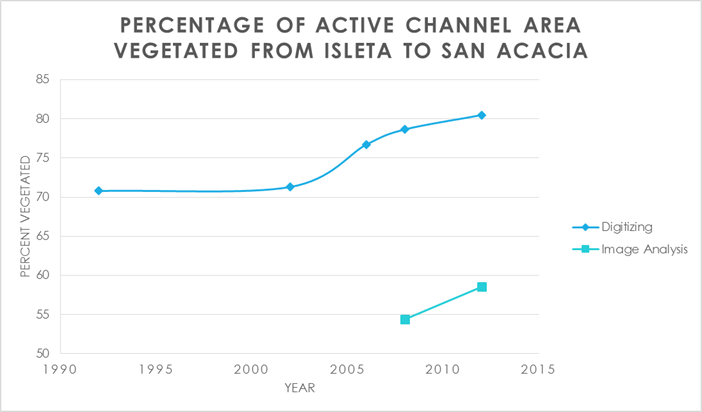
Graph displaying change in vegetated
area over course of study time
This
project completed by Tony Lampert for CE 547 at UNM in the spring of 2016