ISLETA
TO SAN ACACIA VEGETATION TRENDS
OVER
A TWENTY YEAR SPAN (’92-’12)
|
IMAGE ANALYSIS |
Image
Analysis
The decision
was made to try image classification on the 2008 and 2012 stretches to confirm
areas calculated by digitizing. These two were chosen due to the fact that they
are both four band imagery. There were 25 individual aerial polygons that make
up the stretch of river. A quick investigation was made to find which polygon
had the most diverse land cover. Once it was picked, an iso-cluster
unsupervised classification was conducted on this polygon. Along with this
classification, a signature file was created to save the different colors
associated with the aerial map. A batched maximum likelihood classification was
then performed using the signature file. The rasters
were then all mosaicked together. Similar land type colors were assigned and
assembled together in to three distinct groups. Three groups were created which
were vegetation, water, and non-vegetation. The created raster was then clipped
to the boundary used previously.
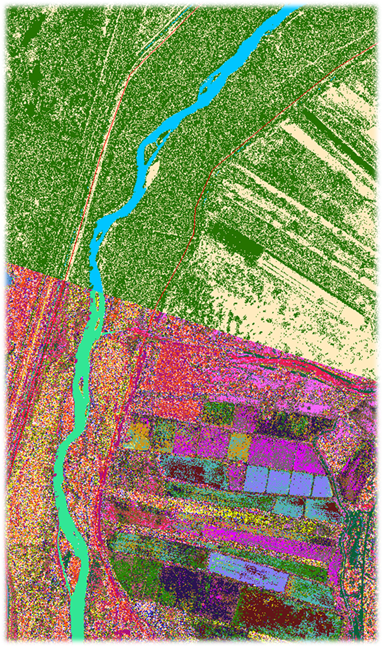
Example of image analysis, bottom being
program results, top being distinguishing between vegetation, water, and
non-vegetated
The clipped
raster was then reclassified so that the vegetated areas could be quantified.
The attributes table only displayed the number of pixels. The number of pixels
was then multiplied by the area of each pixel, 3.24 square feet, to obtain the
total vegetated area. The areas from this method were compared to the method of
digitizing.
|
IMAGE ANALYSIS |
This
project completed by Tony Lampert for CE 547 at UNM in the spring of 2016